Fresh help for severe-storm forecasters

Images released by NOAA on Jan. 23 illustrate the unprecedented views of severe weather that forecasters will have later this year, provided all goes as planned with orbital checkout of GOES-16, the 5,200-kilogram satellite launched in November.
Once operational, the satellite’s main instrument, the Advanced Baseline Imager built by Harris Corp. in Indiana, will generate a complete “disk” image of North and South America once every 15 minutes, plus an image of the continental U.S. once every five minutes and images of smaller areas once every minute when necesssary, says NOAA researcher Tim J. Schmit, who began conceptual work on the ABI in the late 1990s.
Just as importantly, the satellite gathers 16 bands, or ranges of wavelengths, compared to five for the other Geostationary Operational Environmental Satellites. More bands means a greater ability to distinguish features that affect storm development, such as clouds and water vapor. ABI also will watch in multiple bands for evidence of volcanic ash, the bane of airline pilots.
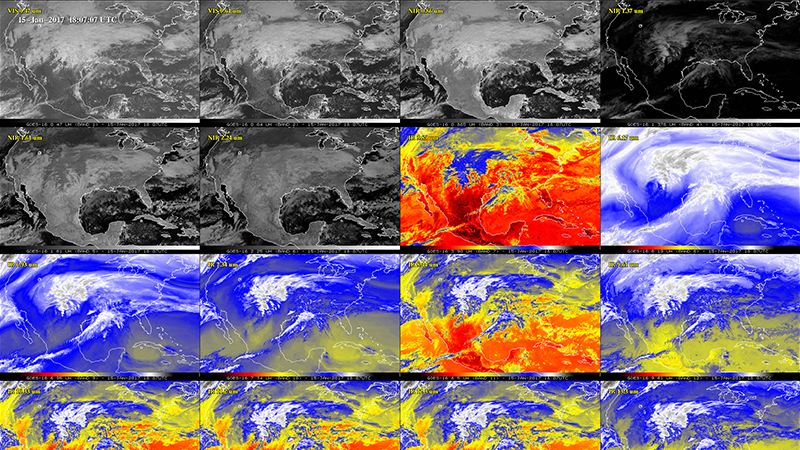
The panel of images above shows what an ice storm that pummeled the central Plains on Jan. 15 looks like in those 16 bands at the same moment in time. The bright blue patch in the largely red and orange image (second row, third from left) shows the presence of cold clouds associated with the ice storm.
To improve severe storm forecasting, ABI detects water vapor in three bands (the three mostly blue images starting with the last one in the second row), compared to one band for the current satellites. “So you can depict three layers of flow in the atmosphere, instead of just one,” Schmit explains. Each layer represents a different altitude, and that data will be assimilated into numerical weather prediction models to better forecast the movement of hurricanes and other storms, Schmit says.
As with today’s satellites, these snapshots of water vapor also will be strung together to create time animations.
Before declaring the satellite operational, NOAA needs to validate its ability to detect actual atmospheric features, like the Jan. 15 ice storm. What’s next? “To know that this works for volcanic ash, we need to have a volcanic ash event,” Schmit says.