Stay Up to Date
Submit your email address to receive the latest industry and Aerospace America news.


Military strategists need to be sure they are sending pilots to battle with electronic warfare equipment that can spoof and evade enemy radars in a host of scenarios. Assessing EW performance once required many hours of costly and time-consuming flights, but today much of the work can be done on a laboratory bench or in a test chamber. Brad Frieden of Keysight Technologies describes how his company achieves this.
BY BRAD FRIEDEN
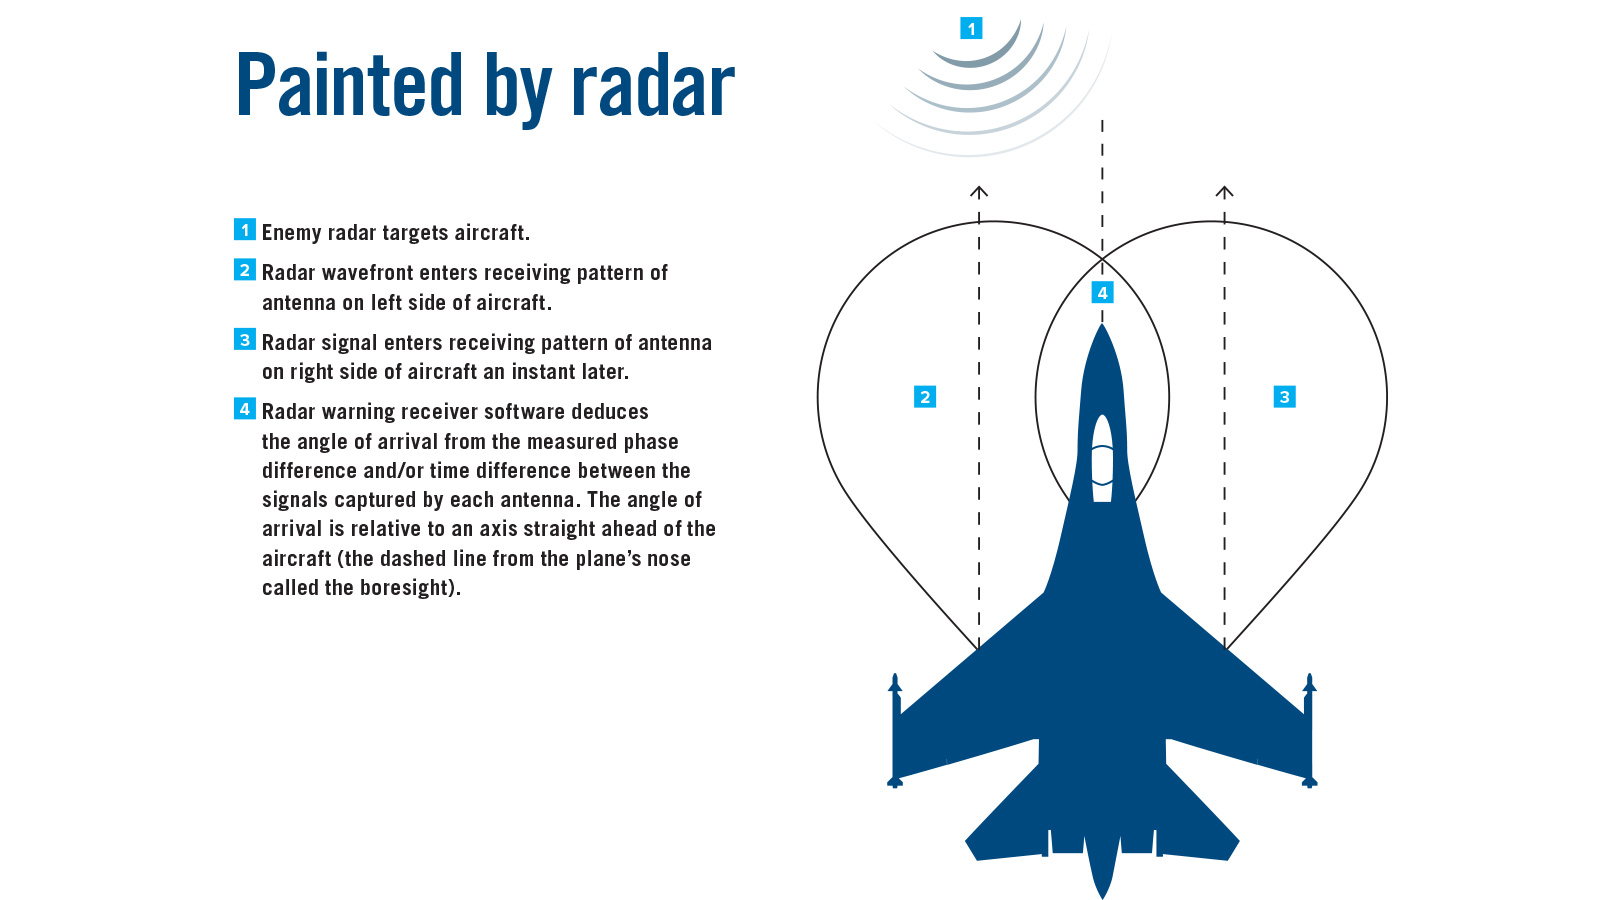
When military planners contemplate being in a battle, they must have confidence in their ability to control the electromagnetic spectrum as a means of protecting a war fighter on the ground, at sea or in the air. Take, for example, a pilot in an aircraft that’s been painted by the targeting radar of another aircraft. Multiple antennas on the painted aircraft’s wings or belly feed a radar warning receiver, or RWR, on board, which must detect this electromagnetic energy and display a warning on a cockpit screen or helmet-mounted display. This warning must identify the other plane and refresh the information at rapid intervals. Most likely the aircraft is a foe, and the pilot’s electronic attack system must be ready to automatically jam the threat radar so the enemy can’t fire a missile. Versions of this interplay can be seen in the ground and sea domains as well.
One option to test electronic warfare systems, such as the RWR or electronic attack radar jammer on an aircraft, is to take to the air with that equipment and perform flight tests, but those are expensive and may radiate signals that are sensitive and could be intercepted. That’s why having a threat simulator, which can create the radio frequency signals that would be present in a battlefield scenario, is critically important to put such systems through their paces before they’re needed in a real conflict. And there are benefits if such a threat simulator can be scalable, calibrated, accurate and quickly available. It’s also desirable if it can have an open architecture, meaning it could accommodate a variety of software packages and standard interfaces. Such a system of software and signal generators would produce an RF and digital rendering of an actual electronic threat, such as a targeting radar, to test RWRs and jammers against the threat without having to fly the aircraft or operate ground vehicles or ships. We decided to make our threat simulator out of off-the-shelf building blocks, namely Keysight N5193A and N5194A UXG signal sources, which are benchtop instruments that can create radar/jammer RF pulses with fast-hopping frequencies for electronic warfare system testing. These can be assembled in a modular fashion to create a variety of system configurations, scalable from simple to complex.
This idea of threat simulation wasn’t a new concept, since jammers had been tested in lab environments simulating the electromagnetic spectrum in battlefield scenarios for many decades. But for customers, acquiring such a system with all these new attributes would be something cutting edge. Keysight shipped its first threat simulator in 2018 and continues to improve upon it.
Converting an oscilloscope
As a primary element to augment a threat simulator’s ability to create realistic EW signals, we converted a wideband oscilloscope, one normally used to measure the performance of high-speed digital communications devices, into an RF pulse analyzer. Imagine, for example, that designers needed to verify that an aircraft’s jammer would react properly to being painted by a radar. They can now run an RF cable between the aircraft’s jammer and our oscilloscope, and then multiple RF cables from the threat simulator rack or racks to the RWR and to the jammer’s input receiver. These cables deliver simulated radar signals as though the aircraft were being painted by an enemy radar. The oscilloscope readings would, for instance, show designers whether the jammer effectively achieves “pull off,” in which electromagnetic pulses designed to look like radar reflections slowly pull the threat radar away from tracking the aircraft’s location, deceiving it. With our oscilloscope and threat simulator, initial testing of a jammer and RWR can be done on a lab bench, with the threat simulator playing the role of an enemy radar. Designers can find performance issues early and fix them, long before any kind of validation in an anechoic chamber is attempted or a final flight test is conducted.
To create this technology, one challenge we faced was on the signal source side. Our simulated enemy radar signal might need to cover a range of frequencies from a few gigahertz to 40 GHz, sometimes hopping quickly between frequencies. In fact, multiple pulsed RF signals might need to be simulated simultaneously. This required sources that could switch from one frequency to another in mere hundreds of nanoseconds. At the same time, complex modulation schemes needed to be simulated with great accuracy to mimic a real threat. Keysight created a computing and hardware architecture to turn models of actual threats in an EW environment into digital representations of received threat signals and then into actual RF that could drive the RWR and jamming input receiver.
This goal for signal generation required us to digitally place modulation on top of a carrier signal. This placement occurs at an intermediate frequency of 1.8 GHz, with precise control of the modulation that rides on the pulses at a bandwidth of up to 1.6 GHz, just as is found in today’s most advanced radar and jammer signals. The most accurate way of placing this modulation on top of this intermediate frequency carrier signal would be to do it digitally. Through a process of digital up-conversion, the baseband modulation signal gets placed on top of a 1.8-GHz carrier signal with great accuracy. Specifically, the integrated circuit achieves this modulation by applying the in-phase and quadrature phase, or I/Q, digital data technique, a method of modulation also used in ultra-high-speed digital communications.
In the real world, threat signals are analog, meaning these signals shift their amplitude smoothly over time. Therefore, we needed to smooth out the voltage steps in our intermediate frequency carrier signal, which we accomplished by incorporating a kind of analog circuitry known as a reconstruction, low-pass filter. This removed the step artifacts left over from digitization, leaving an analog signal.
This 1.8-GHz analog signal is upconverted to the final desired RF frequency, such as a simulated threat radar for the lab. In the real world, threat radars change amplitude of signals within a couple of hundred nanoseconds to try to outsmart a jammer, and it’s common for an aircraft to face multiple threat signals.
Our architecture works off millions of pulse descriptor words, which are lists of parameters for each pulse specifying its start time, frequency, pulse width, amplitude and modulation on pulse. With this architecture we provide a real-time, pulse-descriptor-word-based tool that can be quickly delivered to customers and quickly reconfigured to address multiple threat configurations.
In war-fighters’ hands
How do our customers use this architecture? Consider first a case in which a radar paints an aircraft from a particular direction. If the angle of the incoming radar can be deduced, then the position of the radar relative to the aircraft can be calculated and placed on the RWR display, and now a war fighter could elect to send a signal in that direction to spoof the radar. More often the war fighter depends on their jammer to do this automatically. To determine the incoming signal’s direction, the RWR on the aircraft receives the signal on multiple antennas and from that determines the difference in phase characteristics of the arriving waves. From that, software calculates the azimuth (left to right angle relative to boresight of the vehicle) and elevation (up or down relative to the boresight of the vehicle) of the other aircraft. These phase differences in the signals are called the angle-of-arrival characteristics since they relate to the threat emitter’s direction. Our architecture creates multiple signals with accurate angle-of-arrival phase characteristics to test that a radar warning receiver is properly displaying a threat’s direction. If you don’t get those angles right, you’re not measuring the RWR’s ability to locate the threat emitter.
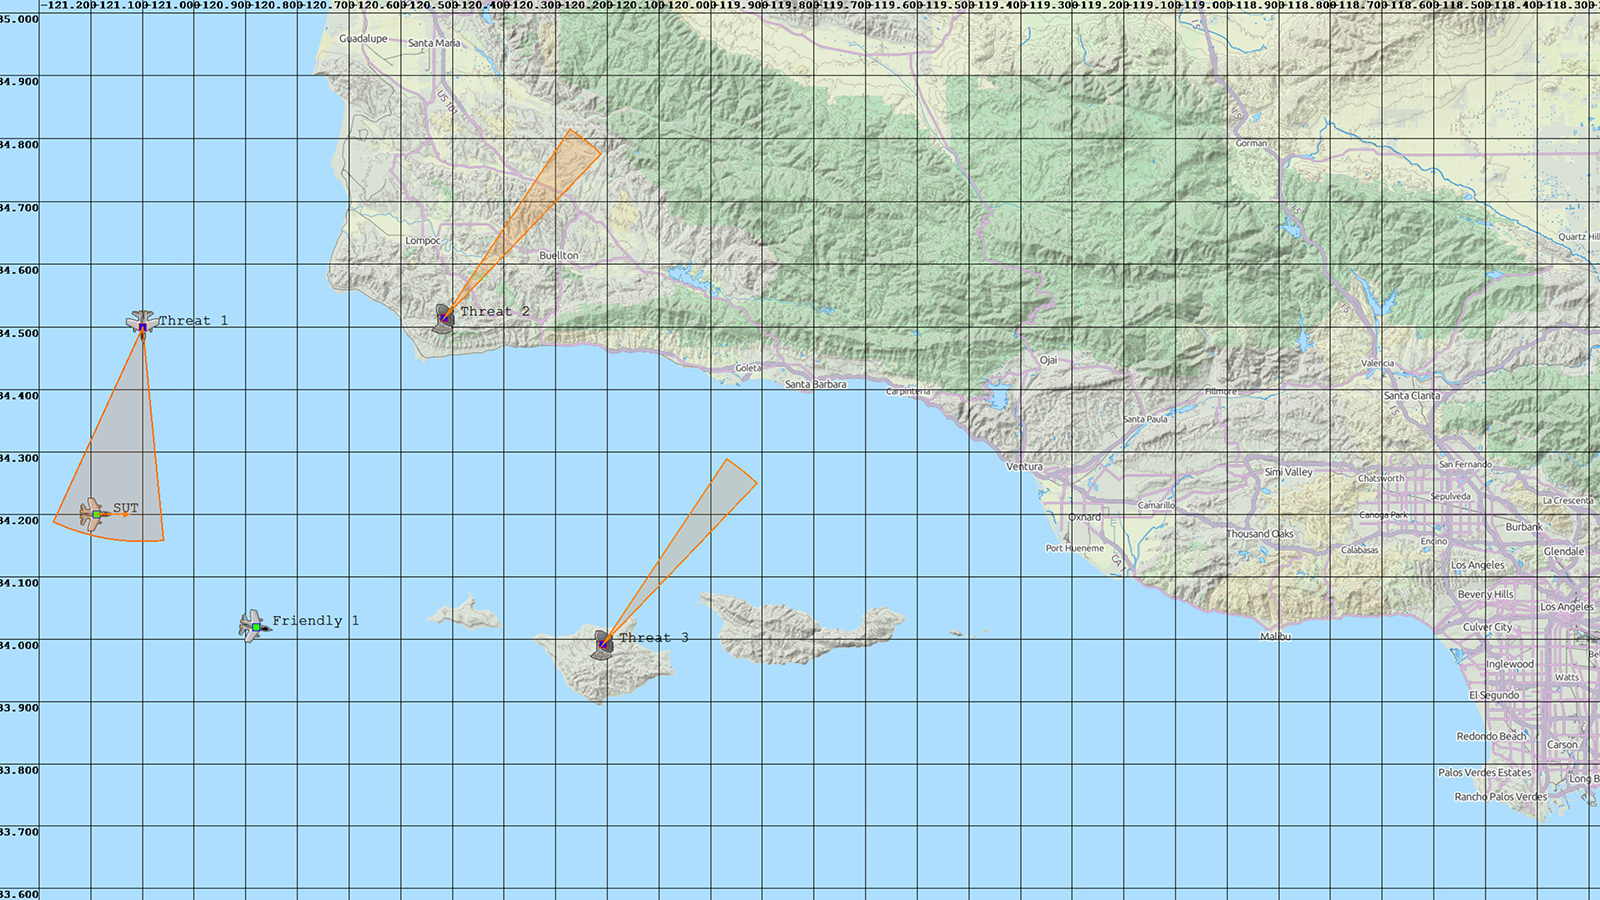
Our signal generators get these angles right through proper multiport calibration combined with Simulation View, software that calculates in real time the expected signal phase differences between the antenna ports, and also provides a graphical game board that shows the simulated aircraft and threats. The team developed a process to synchronize multiple sources together while still maintaining phase coherency across multiple ports. It is imperative to calibrate ports in amplitude, delta phase and delta time to create signals with the proper angle-of-arrival characteristics. The result is multiport signal generation capable of testing an RWR that should sense the phase difference between signals received, so it can properly calculate the azimuth and elevation of the threat radar to know its location.
Commercial oscilloscope for RF pulse analysis
Another challenge, but this time related to signal analysis instead of signal creation, was that we had to enhance our oscilloscope architecture so that it could serve as an RF pulse analyzer, capturing every received RF pulse into memory over seconds or tens of seconds. We combined two data processing techniques to achieve this. One technique was variable-length segmented capture, in which we capture the radar pulses when present and ignore the dead time between pulses. The other technique was real time digital down conversion, which allows us to strip off the modulation from the carrier and process and analyze only the modulation.
To understand the variable-length segmented capture and real-time digital down conversion techniques, imagine that you attended a weeklong virtual conference but only wanted to hear and take notes on the sessions with a certain author. The variable-length segmented capture is analogous to your filtering the conference sessions by the author’s name so only those sessions are printed in your schedule. Then if audio from the sessions of interest were broadcast on a local FM station at 98.1 megahertz, and you had a radio in your room tuned to that frequency, you could hear the sessions because the radio performs the analog equivalent of the digital down conversion. The modulation arriving on the 98.1 MHz carrier radio frequency is converted into sonic frequencies of 20 hertz to 20 kilohertz that you hear. The real-time digital down conversion does a similar thing inside our oscilloscope but in that case, it pulls the signal modulation off a carrier through a purely digital process so you can analyze the radar and jammer pulses.
Various frequency bands often have to be analyzed for pulsed RF applications. Keysight’s UXR has the capability of operating at 256 gigasamples per second, which allows the UXR oscilloscope to operate in bands up to 110 GHz. This sample rate and bandwidth performance allows users to measure signals with carrier-plus-modulation-frequency content up to 110 GHz.
The oscilloscope has to convert ultra-high sample rate data into to a much slower sample rate I/Q data format. For I/Q data format, the sample rate only has to be fast enough to support a bandwidth as wide as the modulation riding on the RF pulses. By doing this, the oscilloscope goes from being able to capture only a handful of milliseconds to potentially being able to have seconds of continuous capture, depending on how narrow the signal modulation bandwidth is.
The UXR real-time digital down conversion I and Q data on each channel drive an intermediate frequency trigger to sense when a pulsed RF radar/jammer signal, with a certain tuned frequency, is present, and only store the I and Q samples into oscilloscope memory for each channel when the signal is present. We call this variable-length segmented capture and it results in extremely efficient signal capture since samples are not wasted on simply capturing noise when no signal is present between the RF pulses. We designed the UXR so that with this capture mode there is zero trigger re-arm time between segment captures. Therefore, no matter how close together RF pulses may be, they can each be captured into variable-length memory segments.
An example application for the UXR oscilloscope would be to determine whether a range gate pull off jammer operates properly. A typical radar system transmits a signal toward a target and then measures a radar echo signal reflected back off the target and tracks each reflected pulse in time. The shorter the time for a radar pulse to return, the closer the target is to the radar. A range gate pull off jammer spoofs the radar by placing larger jammer pulses on top of the radar echo signals at first, and then slowly, over perhaps 10 seconds, moves the jammer pulses away from radar echo pulses up to perhaps 10 microseconds, causing the radar to track the jammer pulses instead of the radar reflection pulses, also causing the radar to believe a false target range. Then the jammer pulses disappear, leaving no signal present for the radar receiver, thus causing the radar to lose track of the target altogether and forcing it to have to reacquire track.
Let’s look more specifically at how the range gate pull off test can be accomplished. The UXR oscilloscope, in a normal acquisition mode for a 30-GHz carrier frequency radar, must digitize the input signal at 128 gigasamples per second, which burns through oscilloscope memory quickly, and can only capture 12 microseconds of time, not nearly the 10 seconds of an entire range gate pull off cycle. With the variable-length segmented capture and real-time digital down conversion, the 30 GHz input signals are still digitized at 128 GSPS, but the samples do not go into oscilloscope memory; instead, they are processed by the UXR into 800 megasample per second I and Q data and stored into 800 megabytes of oscilloscope memory. They are then offloaded to the 89600-vector signal analysis software to conduct pulse analysis such as measuring the pull off times. Only I and Q data samples are sent to oscilloscope memory to when the RF pulses are present as sensed by the intermediate frequency trigger. This results in the ability to capture every radar echo and jammer pulse over nearly 50 seconds to see multiple RGPO cycles and prove proper jammer operation where the radar has 1-microsecond-wide RF pulses that repeat every millisecond.
Finally, we chose a software architecture that could both simulate moving platforms including aircraft, land vehicles or ships, and simulate the signals that receivers on friendly platforms would receive on their antennas, such as enemy radar signals, while setting up analysis test and measurement equipment to easily ensure that the proper signals were created. Key signal characteristics such as center frequency, modulation bandwidth, pulse repetition interval and antenna scan rates are turned into oscilloscope setup parameters. This can save engineers and technicians many hours or days of time through automating the measurements.
With our UXR oscilloscope used as an RF pulse analyzer, and multiple UXG signal sources used for RF pulse generation, important tests on EW systems can now be performed even more efficiently on the lab bench or in an anechoic chamber, thus saving time and money. The advances we’ve made in high-speed test solutions for commercial communications can be applied to the very stringent wideband pulsed RF characterization requirements for the war fighter.
Brad Frieden is a factory application engineer focused on radar/electronic warfare in the Aerospace and Defense group of Keysight Technologies in Colorado Springs, Colorado. He holds a Bachelor of Science degree in electrical engineering from Texas Tech University and a Master of Science in electrical engineering from the University of Texas at Austin.
"With our oscilloscope and threat simulator, designers can find performance issues early and fix them, long before any kind of validation in an anechoic chamber is attempted or a final flight test is conducted."
Brad Frieden
Related Posts
Stay Up to Date
Submit your email address to receive the latest industry and Aerospace America news.