Stay Up to Date
Submit your email address to receive the latest industry and Aerospace America news.

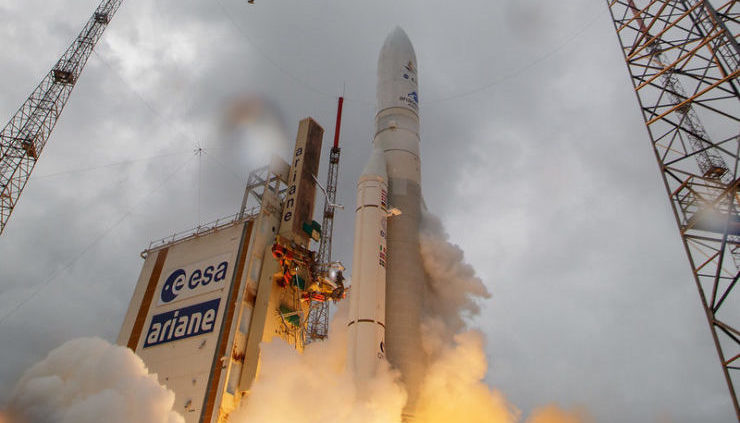
Every do-it-yourselfer knows how hard it can be to declare a project complete. Will another turn of the bolt or brushstroke make things better or worse? That was roughly the choice NASA faced a year before the Dec. 25 launch of the James Webb Space Telescope. Would more testing close more technical risks in the nearly $10 billion project or create new ones? In the end, NASA decided against more testing. NASA’s Jesse Leitner and Tupper Hyde describe the assessment they performed.
BY JESSE LEITNER AND TUPPER HYDE
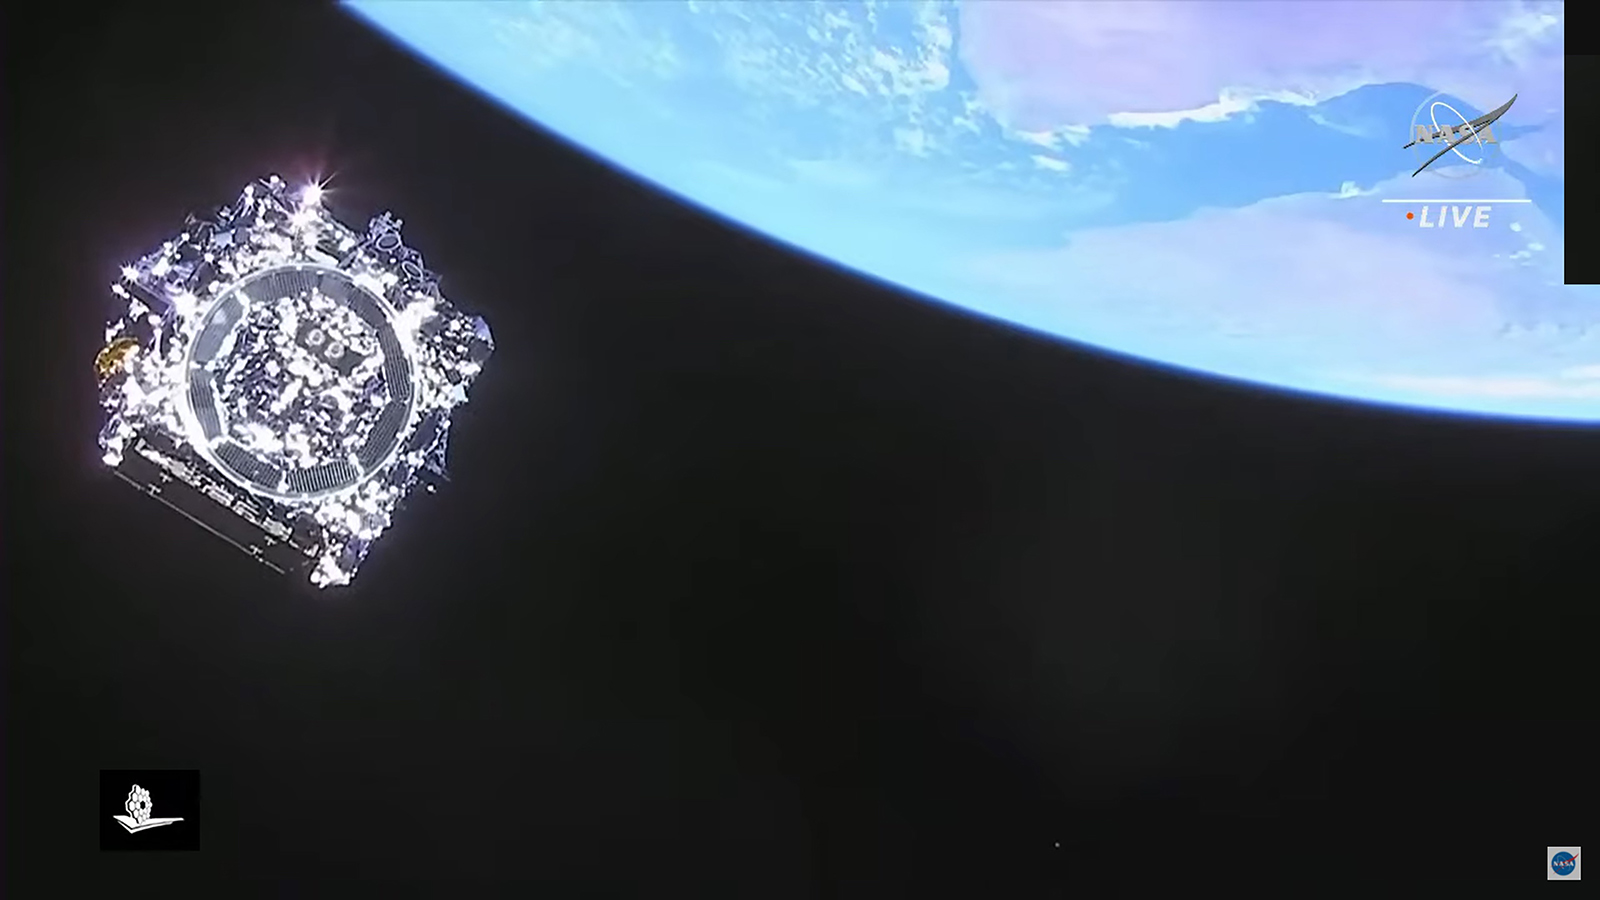
The James Webb Space Telescope’s core science goal of gathering light from the early universe presented the project team at NASA’s Goddard Space Flight Center with a tremendous launch vehicle packaging problem during the conceptual design work in the late 1990s. At that time, the largest available launch vehicle fairing measured just 4.6 meters of usable interior diameter, but detecting infrared light from the early universe would require a primary mirror much larger than that. NASA eventually settled on a 6.5-meter diameter primary aperture and a tennis court-sized sunshade to keep the cold, optical side of the telescope operating at less than 50 Kelvin (minus 223 degrees Celsius, minus 388 degrees Fahrenheit). The primary mirror of 18 segments would need to be arranged inside the launch vehicle in three sections that would be unfolded and brought together in space with nanometer precision to act as a unitary mirror. The five-layer sunshield, each layer consisting of what looked like plastic wrap coated with thin aluminum foil, would need to be compressed and then expanded in space by tugging on cables, something like a sailboat crew raising a sail.
Risk assessment involves predicting the likelihood that failures or other types of problems will occur. After risks are assessed, project leaders and stakeholders determine whether risks are acceptable, so that engineers can find solutions to those that are not acceptable. For the Next Generation Space Telescope, which we now know as JWST, the historical record provided no operational space telescopes of similar designs to provide a basis for historical risks for such a system. Also, ground testing, which is the primary means for mitigating risks, came with great limitations in this case due to the telescope’s size, deployment plan, and Earth’s gravity. The spacecraft including its sunshield and telescope assembly were too large to be deployed to its full configuration in a vacuum chamber. The telescope assembly would need to be tested separately from the sunshield and spacecraft bus consisting of equipment for communications, propulsion and other basic spacecraft functions. Perhaps most fundamentally, in space the sunshield and optics would be deployed in zero g, but there was no way to precisely mimic such conditions at the required scale on the ground.
The project team at NASA’s Goddard Space Flight Center in Maryland, the field center chosen to lead the project, developed a voluminous portfolio of technical risks over the years to assess and address. The reality was that many of them could not be mitigated (reduced or eliminated) in any substantive way, largely due to the 1-g, zero-g differential.
Decision time approaches
Such was the context in December 2020, when we were assigned by Goddard Director Dennis Andrucyk to perform an aggregate risk assessment, meaning one that would examine individual risks and look for linkages among them to reach a judgement about the overall likelihood of mission success or failure. The result of this assessment was a formal memorandum to the center director and an accompanying briefing to the JWST project office, to Goddard management, and to various others involved in assessing the project’s readiness to move forward. While we knew the project well, neither of us were members of the project team, so this would be an independent assessment.
When we began our work, the project schedule demanded a decision shortly about whether JWST was ready to be shipped to the launch site in French Guiana. The sunshield assembly had been tested multiple times at Northrop Grumman’s Space Park facility in California, while the telescope with its instruments had been tested in a vacuum chamber in a multiweek campaign at NASA’s Johnson Space Center in Houston. At Space Park, workers then joined the two segments together, and the complete observatory was fully integrated.
The project’s risk register — a database of open, closed, and accepted risks — was large, but one particular topic was on top of everyone’s mind: the sunshield. No single deployment test had produced entirely satisfactory results. One question the risk assessment would get at was whether to try one last deployment test of the sunshield to shoot for success and a dose of confidence. At that time, the project did not plan to do so because of the enormous efforts, resources, and risk involved with each deployment. Conducting such a test would require weeks of preparation and then work to recompress the shield for launch. But thinking hard about that decision was reasonable. Once in space, if the shield were damaged or did not deploy fully, the needed cryogenic temperatures likely would not be met, and JWST would not deliver the required infrared sensitivity. Of course, with JWST now in space, we were as relieved as anyone last month when a message to the mission operations center in Baltimore confirmed that all five layers of the sunshield were fully deployed, helping to set the stage for months of commissioning ahead. In December 2020, we could not know how things would come out for the sunshield, and at this writing we do not know how commissioning ahead will go. We are encouraged by the confidence derived from performing the assessment and the positive results to date.
A modern approach
Our assessment work lasted approximately three months and benefited from a decision NASA Goddard made in 2002 to initiate creation of formal risk statements for its space missions. Prior to 2002, those working on JWST employed informal risk management, without formal risk statements or a risk database. This meant that risks were indistinguishable from risk factors, concerns, and worries or watch items. Under this old approach, risk determinations were often emotionally driven (often by gut feel, rather than detailed analysis) or speculative in nature, as was characterized by the format of the less structured (namely, lacking a driving context) risk statements of the day:
If <event occurs>
Then < consequence occurs>
The problem with this approach was that an if/then statement does not describe the context indicating the likelihood of something going wrong. Without such context, a likelihood determination would be arbitrary.
By the time of our assessment, Goddard had shifted to contextually driven (three-part) risk statements as the standard process:
Given: <existing condition or scenario>
It is possible that <undesired event occurs>
Resulting in <consequence to the project>
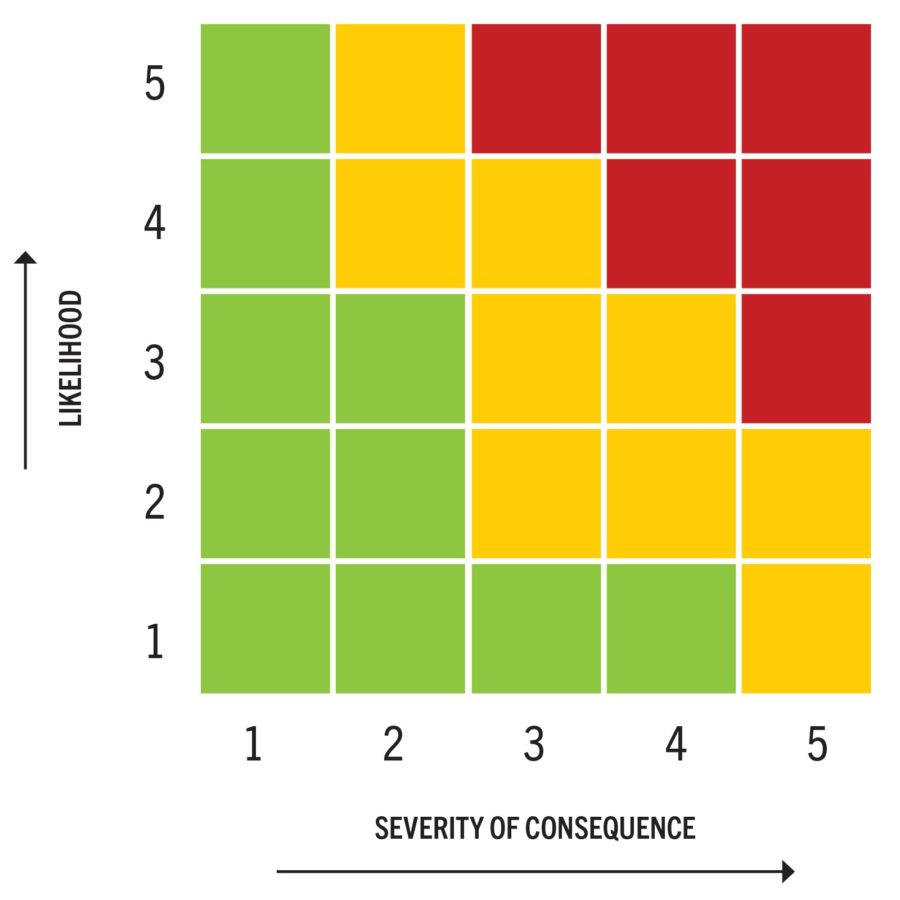
At Goddard, just as elsewhere at NASA, the likelihood of a result is now expressed as a percentage on a risk scale, and that likelihood is now matched to the severity of the potential consequence by referring to a five-level, color-coded matrix (see graphic). Risks can now be discussed in a numeric rather than emotional manner based on this likelihood-consequence, or LxC, matrix. So, a risk with an LxC of 1×5 has a low likelihood of happening, but if it happens, the consequence is severe. An LxC of 5×1 means there is a high likelihood of the risk happening, but the consequences aren’t very scary.
In our aggregate assessment, we applied this modern approach, which began with a review of all of the risks in the risk register and subsequently aggregated those that were in related categories.
Reviewing the database
We quickly saw that the JWST risk register provided a holistic and complete understanding of the broad concern and risk profile for the mission, including a well-thought-out assessment of the potential performance shortfalls for the mission. But many of the closed risks in the register dated back many years to the if/then form of risk statement and came with the caveats we mentioned earlier. Without context, they just represented past worries as opposed to formal, credible risks.
At the time of GSFC’s transition to the contextually driven risk structure, the project’s risk board brought the unresolved risks that had clear context into the modern risk structure. Most of the open risks at the time of our assessment could not be closed until processing at the launch site, or on-orbit. For example, some risks that involved a possible deployment problem could not be closed until the deployment occurred on-orbit. Other risks were related to the functioning of the instruments and optics in the real thermal and gravitational environment and thus could not be closed until commissioning was completed.
In addition to consulting the register, we had to review recent events to ensure that no new risks had emerged that were unaccounted for.
On this front, since late 2019, new anomalies had accumulated in various levels of testing. Many of these occurred after the last full observatory-level tests had been completed. Since many involved changes or “use-as-is” dispositions without the ability to verify the corrective actions or “leave alone” determinations at the full observatory level, it was essential to understand, characterize, and communicate any related risk impacts on the mission as part of this overall assessment. For the most part, these late anomalies came in four sometimes interrelated categories:
- Tears in blanketing, such as in the thermal protective material over the electronics and other sensitive components, and in the sensitive sunshield membranes
- Issues with cable tension and guiding sleeves for the sunshield deployment mechanisms
- Issues associated with the accumulation (or “stack-up”) of a range of tolerances throughout the observatory (tolerance in this case represents a generally small variability that can contribute to changing some expected dimensions when the observatory is deployed); these stack-up errors could result in either a deployment problem or an improperly aligned telescope that could be uncorrectable
- Issues associated with effects of gravity during testing and the inability to entirely offload gravity (e.g., using rails with pulleys or cables); such devices could only provide localized or discrete simulation of gravity removal but obviously cannot eliminate the effects of gravity entirely
The anomalies were all resolved with root causes corrected, but we nevertheless reviewed each to see that the resolution was vetted against the final configuration of the observatory, not just against the configuration that existed at the time of the anomaly/failure resolution. We examined in detail the resulting systemic cross-effects from the multitude of configuration changes required to address each anomaly, since there was to be no additional full deployment of the complete system after some of these changes, barring a decision after our assessment to do otherwise.
On the topic of tears, there was no indication of a systemic concern or risk associated with them. Our analysis determined them to be a natural consequence of the extreme sensitivity of the blankets and sunshield membranes combined with the regular handling of the large observatory. This was determined to be best addressed by a comprehensive examination of all such surfaces, including those that had been repaired, at the last reasonable opportunity before preparing the observatory for launch, which was incorporated into the launch processing procedures. To some extent, the other bullets all combined to characterize an inherent risk for such a large observatory as follows:
“Given: the large and complex observatory designed for zero-g operation, with extensive mechanical interconnections and the need for meticulous handling within the observatory
There is a possibility that: the 1-g testing environment with limited ability to off-load gravity will give rise to a stacking and cabling discrepancy on-orbit that affects a key deployment,
With the result that: some observatory functions will be degraded.”
In other words, the conclusions drawn from integrating and testing a massive, flexible zero-g observatory under the effects of gravity might not be fully relevant to the operation in space, and thus one or more of the deployments might not get an instrument into its ideal performance configuration. The design team mitigated this risk by incorporating margins into the design to accommodate stray light, image quality issues, and cryogenic temperature offsets.
In our assessment, we recommended an LxC of 1×4 for this subaggregate risk. The 1×4 risk level represents a likelihood between 0.1% and 2%, with a consequence being a major impact to full mission success criteria.
Key risk areas
The risk posture at the time of this assessment was largely characterized by accepted and open risks, but this posture had the potential to be influenced by ongoing issues at the time that had not yet been fully resolved, such as anomalous behavior with the primary and redundant communication transponders (these issues traced to combined workmanship and materials concerns on the electronic assemblies). At the finest level of detail, the key risk areas were as follows:
- Extensive use of nonexplosive actuator devices that have minimal fault tolerance, that are critical to the deployments, and that could not be fully tested without “resetting.” Resetting was not only costly and time-consuming, but in some cases risky because it involved more configuration breaks and handling.
- The use of the new three-quarter inch (2 centimeter) diameter nonexplosive actuator devices in critical applications without past history. This risk area was mitigated by an extensive (multiyear) development program and a full qualification program.
- The incorporation of nonexplosive actuators into Membrane Release Devices (MRDs), which were higher levels of assembly that held the sunshield stowed, that brought about an addition of application risk. This risk area was mitigated by a full qualification program at the MRD level.
- The limited ability to test the enormous observatory based on both practical constraints and necessary response to issues identified late in development that preclude a complete test in flight configuration.
Aggregate risk assessment
All risks were reviewed for aggregation. While there were a pair of items related to one of the JWST primary instruments, the Near-Infrared Camera, or NIRCAM for short, the facts indicated risks to be well below credible likelihoods (meaning less than 0.1%). The primary candidates for aggregation involved the deployments, most notably the sunshield. There were several such risks, most of which overlapped in some way. These related to the fact that the observatory could not be fully tested in final flight configuration. Doing so would require deploying a tennis-court-sized sunshade without gravity, under extreme range and distribution of thermal conditions. Regarding the separate testing of the sunshield and telescope assembly, there was no prior heritage to put to rest any interactions that might not have been observed when each was tested individually. We ultimately captured two large, aggregated risks, the first of which was as follows:
“Given: the massive size, complexity, development constraints, and one-of-a-kind nature (with no historical reliability) of the JWST observatory that prevent complete test as you fly verification and/or validation of complex models,
There is a possibility that: a key interaction that impacts system performance is not identified,
With the result that: mission performance will be moderately degraded.
Recommended LxC: 2×3.”
This assessment reflected the fact that without the ability to test the full system in its ultimate configuration and environment, a key detail related to the thermal environment and lack of gravity may have been missed on the ground. For example, gravity may have benefited an aspect of alignment of the telescope and one or more instruments without the team’s knowledge, and the actuator range might not be sufficient to make up for this benefit.
This risk assumed that the deployment was sufficiently successful, but that there may have been some other related effects to degrade instrument performance.
For the second aggregate risk, we also defined a catastrophic variant of the preceding risk based on the same context that includes the threat of a failed deployment:
“Given: the massive size, complexity, development constraints, and one-of-a-kind nature (with no historical reliability) of the JWST observatory that prevent complete test as you fly verification and/or validation of complex models,
There is a possibility that: a key system interaction that is not accounted for or modeled with sufficient fidelity in the 1-g testing environment combined with limited ability to off-load gravity will give rise to a stacking and cabling discrepancy on-orbit that affects a key deployment,
With the result that: mission will fail to meet minimum success criteria
Recommended LxC: 1×5.”
This risk subsumed the 1×4 sub-aggregate risk mentioned above, which is not independent.
Without the ability to test the full system in its ultimate configuration and environment, a key detail related to the thermal environment and lack of gravity may have been missed on the ground. For example, on the ground, gravity can provide a tension in a cable that may otherwise be slack, and that tension may be needed to obtain the full range of deployment.
The two aforementioned aggregate risks were brought to the project risk board, debated, and ultimately captured within the project’s risk register as some of the key risks that would be carried through to launch. With JWST in orbit, the 2×3 risk will not be retired until commissioning is complete some months from now, while the second risk could be retired after the deployments are completed, and thus at the time of this publication, is indeed retired.
The test-more or proceed-to-launch dilemma
The typical space mission, no matter how large, affords the luxury if funds and time are available to step through challenging operations as many times as necessary to ensure that they can be performed repeatedly without any failures, anomalies, or unexpected events until the operations are assured to be flawless. For years, the same expectation was on the minds of many that the same could be said for JWST. Some even said we would especially need multiple sequential and repeated successes for JWST. However, the fact was that each subsequent deployment involved some type of unexpected
response that required (or at least prompted a strong desire for) a corrective action or improvement. There was a point at which the project had exhausted its allocation for further testing of the sunshield without threatening damage to the flight hardware due to handling and causing further launch delay. It had been demonstrated that the sunshield material breaks down after repeated folding and handling.
Given the project team’s confidence that it fully understood the most recent anomalies in deployment testing in late 2019, the project planned to proceed without another full-scale deployment. Our assessment helped make it apparent that this was, in fact, the best decision for a more fundamental reason. Our review of the late anomalies holistically revealed that there were paths crossing that weren’t apparent from the review of the individual anomalous events as they occurred. To characterize what was really happening required a review of the sequence of anomalies combined with a fundamental understanding of the unique aspects of JWST — the design of a massive flexible structure that naturally sags into an out-of-spec condition in 1-g without the ability to realistically emulate zero-g for testing. In other words, there was no reasonable way to offload gravity as if it weren’t actually there, notwithstanding the thermal conditions present. Also, our holistic review of the full collection of anomalies (dominated by those related to the sunshield deployments over the past year) showed that the anomalies were a growing combination of the artifacts of the discrepancy with actual wear and stresses exacerbated by human factor pressures resulting from repeated deployments. Successive deployments had surpassed the point of diminishing returns and further deployments would almost certainly have the effect of increasing, rather than reducing the risk of an on-orbit problem, or even notably damaging the system on the ground.
Our assessment rolled up the most significant element of the JWST risk picture into two key risks: the potential for a noncatastrophic problem in commissioning the instruments after a largely successful deployment, and the potential for a mission failure due to failed critical deployment. It also removed some lingering questions many had about whether more deployment testing should be performed. The aggregate risks were in some sense the perspective that needed to be communicated to stakeholders outside the project. The project knew it had literally done everything possible to make the mission a success, but communicating why was a major challenge.
A well-timed, independent, aggregate risk assessment went a long way to providing a commonly understood statement of the remaining risk for stakeholders. With this, they could be confident that everything that could be done had been done so that they could be comfortable with the decision to ship for launch.
Related Posts
Stay Up to Date
Submit your email address to receive the latest industry and Aerospace America news.