Flying fast, flying quiet
The path to the potential return of supersonic passenger flights travels through an artificial living room, specifically the Interior Effects Room at NASA’s Langley Research Center in Virginia, better known as the boom room. It’s furnished like a typical suburban American living room, with bookshelves, a flat screen TV and stereo, curtains, paintings on the wall, a coffee table, and a chair and couch. Here, starting in 2011, NASA engineers sat down test subjects to listen to and rate their annoyance from recorded and simulated airplane noise. Speakers pointed at the walls from the outside emitted a range of sounds based on recordings of supersonic F/A-18s, from muted thumps to sonic booms that rattled the fake windows.
This testing and other experiments dating to the 1980s helped engineers from NASA’s Commercial Supersonic Technology Program decide just how quiet a future supersonic jet would probably need to fly to be accepted by the public and the FAA.
The FAA banned supersonic flights over land even before the supersonic Concordes began their trans-Atlantic flights to the U.S. in the 1970s. The planes were not permitted to fly supersonically over the U.S. Most other countries also prohibit commercial supersonic flight over their territories. What’s changed is that modern computational fluid dynamics and computing are providing confidence that engineers can shape an aircraft to deliver a vastly softer supersonic footprint. To prove it, NASA plans to hire a contractor to build a supersonic X-plane for a series of flights starting in 2020.
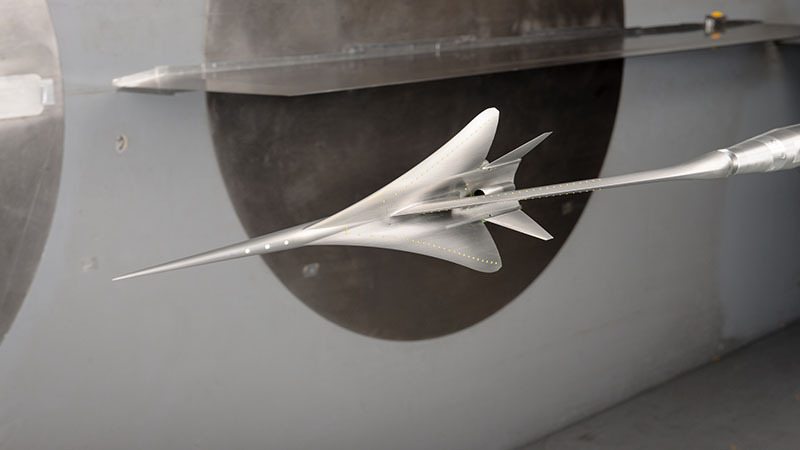
Wind tunnel tests are slated in February on a preliminary design crafted by Lockheed Martin Skunk Works, called QueSST, for Quiet Supersonic Transport. Engineers will install a 9-percent-scale model in a high-speed wind tunnel at NASA’s Glenn Research Center in Ohio to see if the shape delivers the desired result. A preliminary design review will follow in June, and in August Lockheed Martin will deliver a flight simulator and additional QueSST models to NASA. After that, NASA plans to share the design and test data with the industry and hold a competition in 2018 for the right to build the single-pilot X-plane. It would be one of five X-planes NASA wants to fund under its New Aviation Horizons initiative.
The hope is that the flight tests will provide justification for lifting the ban on supersonic commercial flights over land, if the Trump administration has not already done so, as the transition team was reportedly considering. Airplane makers might then choose to make passenger jets that would cut current flight times in half. The first of the new class would be corporate jets or 100-passenger versions, but large airliners could follow if additional innovations are made.
Supersonic airplanes typically produce a double-cracking noise of at least 95 A-weighted decibels, or dBA — a measure of loudness in the frequency range detected by the human ear. On the dBA scale, a pin dropping would be 10 dbA; whispering 25 to 30 dBA; normal human speech 60 to 70 dBA; a lawnmower 90 to 100 dBA; and a jackhammer 110 dBA.
The audible portion of the X-plane shock wave would sound about like riding in a luxury car on a highway. The sound would not be noticeable above the noise of people conversing or a stereo at a low volume, engineers say.
“You get a thump, equivalent to if you get out of your car and your neighbor a few doors down gets out of his car and slams the door, you hear a thump. But it’s not really a disturbing sound,” says Peter Coen, who manages the Commercial Supersonic Technology Program at NASA Langley.
Lockheed Martin Skunk Works finished building the wind-tunnel scale model of its QueSST concept in December and planned to ship it to NASA Glenn. The Skunk Works designers in Palmdale, California, ran 9,000 potential solutions on the design to optimize it, says the company’s Peter Iosifidis, program manager for the QueSST aircraft preliminary design.
Computer simulations show that the X-plane would be a “low boom” aircraft peaking at far less than the 95 dBA sonic booms produced by the Concorde jets that stopped flying in 2003.
Lockheed Martin engineers demonstrated in 2011 that they could accurately predict the acoustic signature of a supersonic airplane, as designed on paper and proven by the actual noise produced by a different 9-percent model in a high-speed wind tunnel. That demonstration opened the door to computational fluid dynamics designing and optimizing without having to wind-tunnel test each iteration.
Any disturbance in the air flowing over a supersonic airplane creates a shockwave. Typically the nose, canopy, antennas, wings, tail and other protuberances create mini-shockwaves at different strengths moving at different speeds, and these small shockwaves pile up as they travel to the ground, combining into two large shockwaves, from the front and rear of the aircraft.
By shaping a plane to control the strength and position of the many small shock waves emanating from the body of a supersonic plane, designers can create shock waves that are relatively evenly spaced and equal in strength, so the waves don’t coalesce and are more easily dispersed by the atmosphere as they travel to the ground, says NASA’s Coen. Instead of the two sharp increases in air pressure and sound that mark a typical sonic boom for a listener on the ground, an airplane designed to control its sonic boom will create more gradual changes in air pressure that are less noticeable and therefore less annoying.
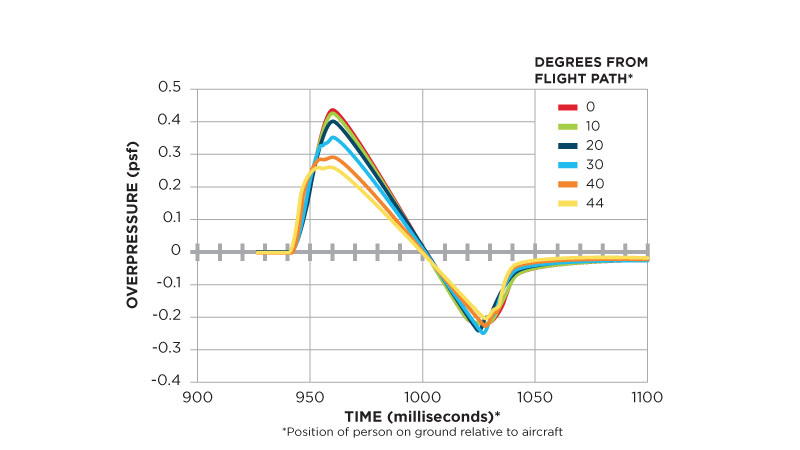
If one were to chart the pressure changes over time as heard on the ground beneath a conventional supersonic jet, the line would be shaped like an N. It would start at ambient level and rise sharply, then decrease to below ambient, followed by another sharp increase. The line for a controlled sonic boom would look more like an irregularly shaped sine wave than an “N,” rising and falling more gradually. It would peak at 65 dBA or less, Coen says.
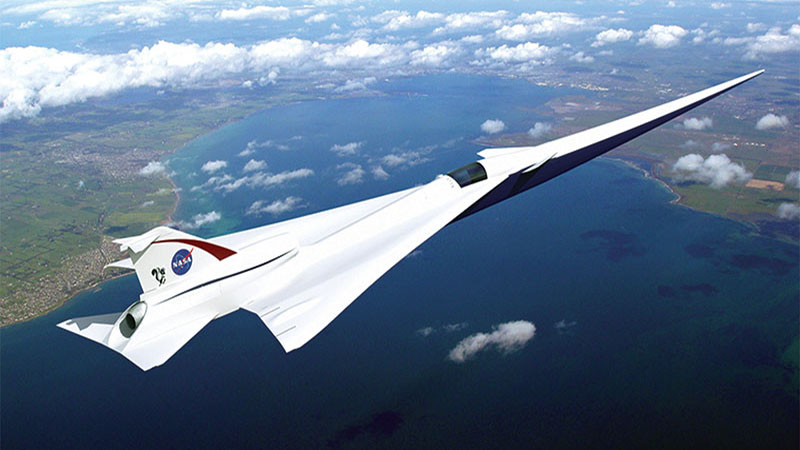
Lockheed Martin’s designers drew up a plan for a plane whose noise signature, if charted, would be an irregular sine wave. The air pressure of individual supersonic shock waves weakens, and the waves spread over time. The plane’s long pointy nose creates a weak bow shock, or initial shock. Lengthening the fuselage spreads the acoustic signature. The dart-like shape of the airplane and its extreme fuselage tapering eliminates the forward-facing window for the pilot, who views the front-facing scene through a computer-aided external vision system.
Small canards, or tiny wings, project from the fuselage in front of the main wings to help the airplane trim during flight. They also distribute shock waves more evenly along the length of the plane. The main wing shields the jet engine’s inlet from the ground, reducing the shock wave emanating to people on the ground. A horizontal tail wing shields the exhaust end of engine for the same purpose. The airplane has a conventional tail wing arrangement, but also has a small T-wing that designers added not for airplane control, but to reduce the aft shock wave.
The 28.7-meter-long, 10,886-kilogram QueSST would fly at Mach 1.4 at up to 55,000 feet. Future designers would draw on data from the computational modeling backed by wind-tunnel testing of the design. This data establishes how each feature of the design contributes to the plane’s shock waves, Iosifidis says. Those designers could apply the same methods to design larger aircraft with the same noise level as QueSST, but the QueSST design won’t simply scale up to a commercial passenger plane.
Beyond the shaping in the design, every component of the Lockheed Martin would be commercially available off-the-shelf or from salvage, Iosifidis says — a T-38 pilot’s canopy and ejection seat; a modified Boeing F/A-18E/F Super Hornet jet engine; and the landing gear from an F-16. “There’s no other technology, other than shaping, to actually achieve the noise signature.”
Coen says that airplane designers could design, with shaping and currently available technology, a low-noise supersonic corporate business jet, or even a 100-passenger, 136,000-kilogram airplane.
For a 200-passenger supersonic plane, shaping might not be enough. The weight of an airplane is an important component of its supersonic shock wave, because the larger the airplane, the larger the lifting surfaces, and the stronger the shock waves and the more difficult they are to manage. NASA’s vision is that airplane makers will innovate once the supersonic market is re-opened, with the X plane as the starting point for technology that will evolve into supersonic airliners.
“If you solve the sonic boom problem, the market will open for supersonic business aircraft, some companies will enter that market,” Coen says. “That will help further prove the technology and also open a market and develop an appetite for supersonic flight.”
If airplane designers are to create a low-boom supersonic airliner capable of carrying 200-plus passengers, perhaps in 25 years, today’s researchers will have to develop new ideas for modifying air flows around supersonic planes, Coen says.
“Could [shaping techniques] improve in 20 years? Maybe. But from my perspective, if we’re eventually going to have an airliner, we need all of the technology,” Coen says. Flow modification, along with other developing technologies, “needs to be explored at the fundamental level now, so 25 years from now it’s ready for application in a practical product.” ★
“If you solve the sonic boom problem, the market will open for supersonic business aircraft, some companies will enter that market. That will help further prove the technology and also open a market and develop an appetite for supersonic flight.”