
If the COVID-19 models remind you of the Kessler Syndrome, they should
The math underlying the predictions in a pandemic and what is known as the Kessler Syndrome can be expressed with similar equations. In each situation, the prediction depends on the frequency that some “Object” encounters a “Victim.” In a pandemic, the Object is a virus and the Victim is a person. In Earth orbit, the Object is a large piece of debris and the Victim is a structure or another large item of debris. The frequency with which an Object hits a Victim is proportional to their speed relative to each another. If that were the only factor, then we would see a slow, linear increase in Victims with time.
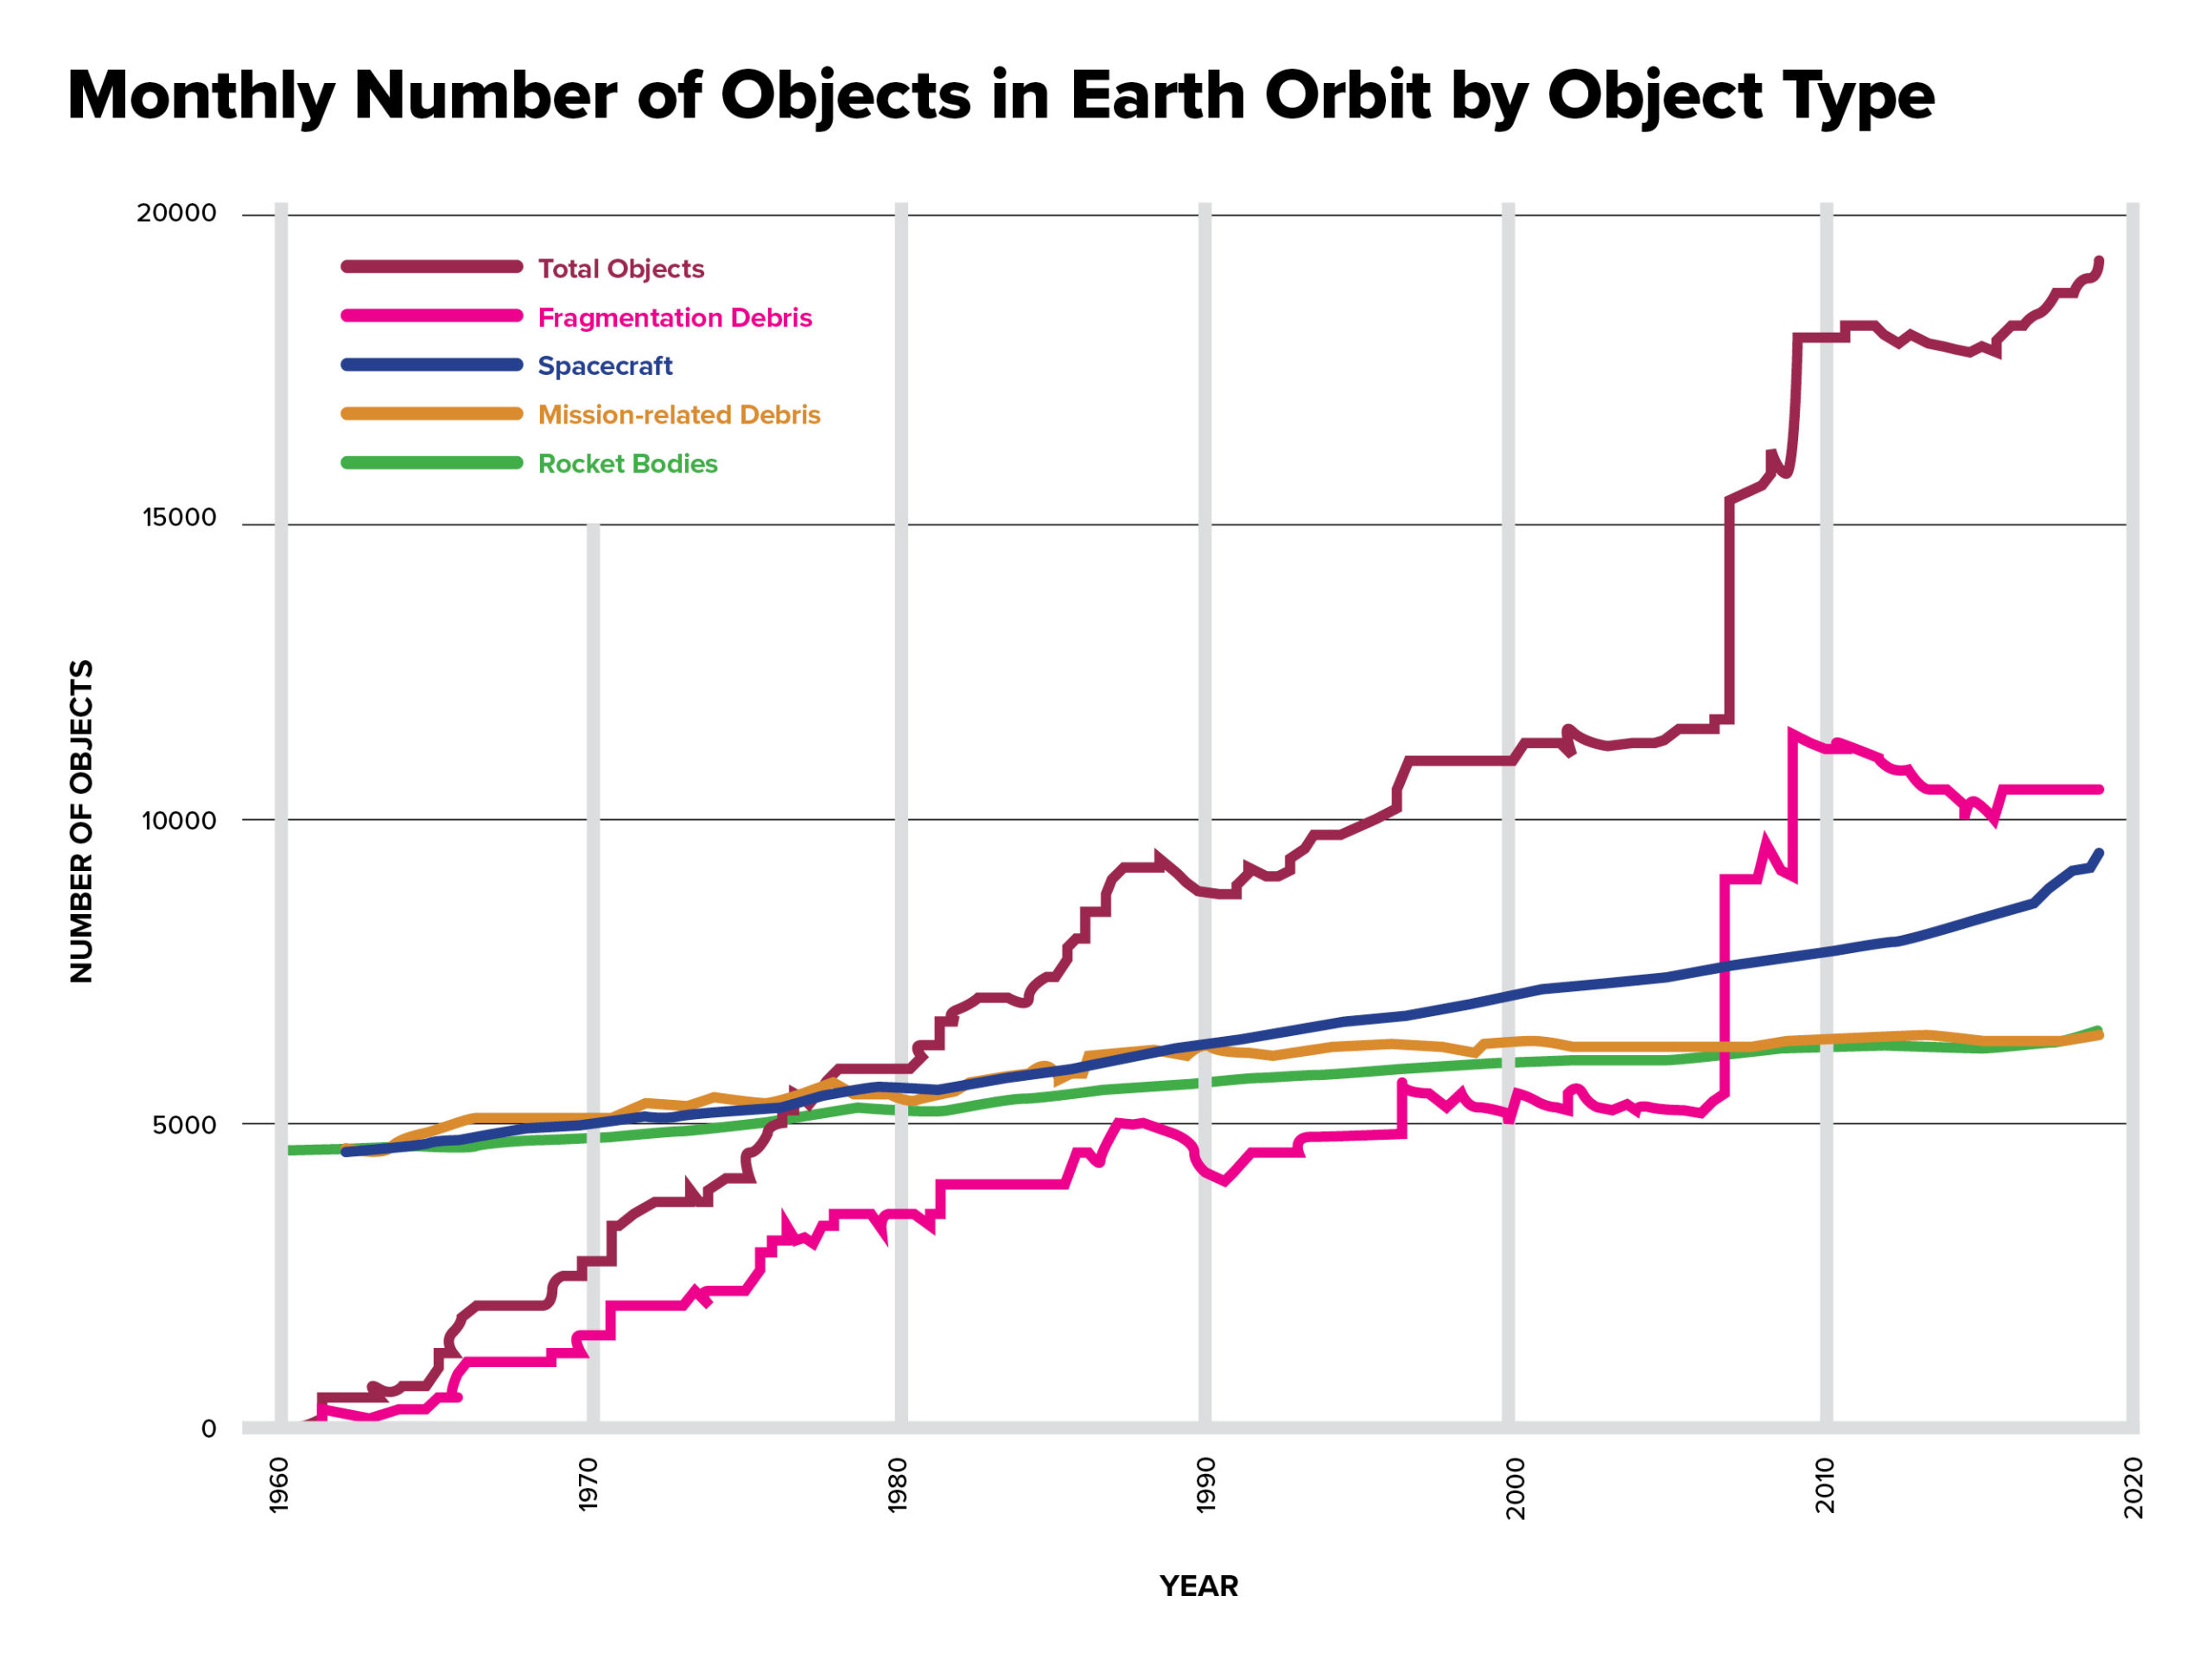
However, in each case, an Object that hits a Victim creates more Objects, each creating even more Victims, i.e., a cascading. This results in an exponential increase in Victims with time — with much greater speed in a pandemic than in orbit, of course — and will continue until there are no longer any operational satellites in orbit or vulnerable people in a pandemic.
That’s the simple answer — the math is the same. The uncertainty in the equations is “Frequency.” In the pandemic, how quickly the virus transfers itself from an Object is determined by biology and by human behavior.
Thirty years ago, NASA formulated mitigation guidelines for orbital debris that have been adopted internationally. Other countries made the guidelines mandatory, but NASA’s implementation has lagged. As a result, these measures have failed to adequately slow the growth in the debris population. The same results can be expected if the virus mitigations are not followed.
Don Kessler established NASA’s Orbital Debris Program Office in 1979 and continued researching the topic until his retirement in 1996. His calculations showing that cascading collisions could someday render entire orbits useless became known as the Kessler Syndrome. He now lives in North Carolina.