
Meteorologists might have a way to wave pilots around dangerous pockets of cold air
When a British Airways jet lost thrust in both engines on the way into Heathrow Airport in 2008 and crash landed short of the runway, the initial examination of the Boeing 777 and its engines yielded no clues about the cause of the accident that miraculously killed no one. The engines did not show evidence of a bird strike, or mechanical failure, and the plane had plenty of fuel.
The United Kingdom’s Air Accident Investigation Branch eventually determined that, as the plane flew high over Siberia and Scandinavia in temperatures of minus 74 Celsius, the small amount of water commonly found in jet fuel had in this case coalesced into ice crystals. Those crystals were jarred loose during the descent and restricted the flow of fuel through the plane’s fuel oil heat exchanger, a component consisting of a thousand small tubes surrounded by hot oil that warms the fuel before it reaches the engines.
The aircrew never knew any of that as they cruised through the cold air. Their Engine Indication and Crew Alerting System was tracking the temperature of the fuel, but the alert threshold was based on viscosity, not fear of ice. An alert would have sounded if the temperature sank below 34 Celsius, because at that point the fuel’s viscosity or thickness could increase enough to slow the flow of fuel to the engines. The temperature bottomed out at minus 34 and the alert never sounded. It was only after this crash that safety experts recognized that temperatures of minus 10 Celsius can create ice in fuel and compromise the performance of fuel oil heat exchangers.
What aviation authorities in the U.S. would really like is to equip air traffic controllers nationwide with forecast maps showing expected cells of dangerously cold air at various altitudes and locations. The controllers could then alert crews to change altitude or heading to avoid this cold air aloft.
After the Heathrow crash, meteorologists redoubled efforts to pinpoint these dangerous areas of cold air aloft. The trouble was that in 2008 they had sparse temperature readings from aircraft and weather balloon radiosondes to feed into their global weather forecasting models.
Then, in 2011, a Delta 2 rocket boosted the NASA-NOAA Suomi National Polar-orbiting Partnership satellite into orbit. Among its instruments was a first-of-kind sensor called CrIS, the Cross-track Infrared Sounder. It soaks up heat emitted by the atmosphere to profile temperature and moisture at dozens of altitudes. The satellite also carried the Advanced Technology Microwave Sounder, or ATMS, which detects heat by measuring microwave energy emitted from the atmosphere and surface. Moisture droplets in clouds block infrared energy, but microwaves pass right through to show the temperatures below the clouds.
A few years after the launch, researchers from NASA, NOAA and the academic world were looking for problems they might be able to solve with CrIS and ATMS. Meteorologist Eric Stevens of the University of Alaska, who is the liaison between meteorology researchers in Alaska and the National Weather Service, suggested that the sensors might be able to find areas of cold air aloft.
It’s perhaps not surprising that this project began in Alaska. That state has the same problem with cold air aloft as Siberia and Scandinavia, plus 6.2 million square kilometers of airspace and only 14 helium balloons, called upper air sounding stations. These take temperature readings every 12 hours by dangling radiosondes from them.
“That is just the tip of the spear for us getting the actual temperatures through the atmosphere,” says Gail Weaver, an aviation meteorologist at the Anchorage Center Weather Service Unit. Often, aviation meteorologists ask air traffic controllers to solicit air temperature reports from flight crews, but the data is limited to a single altitude.
Alaskan meteorologists are in the midst of an experiment with NASA and NOAA to turn readings from CrIS and ATMS into three-dimensional temperature maps. The maps are shared with air traffic controllers who notify aviators flying through Alaska airspace. Pilots can then request flight routes around the cold cells. The experiment has been so successful that NASA research meteorologist Bradley Zavodsky says it could be implemented nationwide in the next couple of years.
“We use this data to say, ‘Hey pilot, I know it’s 75 below [zero] where you are right now but if you make a hard left turn and descend 4,000 feet you’ll be in much warmer air,’ ” says Stevens.
NASA, NOAA and academic researchers identify the 3-D cells of cold air with the help of an algorithm called the NOAA Unique CrIS/ATMS Processing System. They transfer the information to the Advanced Weather Interactive Processing System, which analyzes and displays data for NOAA and National Weather Service forecasters.
“It gives us a snapshot vertically and horizontally of where that cold air aloft is in our airspace,” Weaver says. “We can see what direction it’s moving in and if it’s intensifying or weakening.”
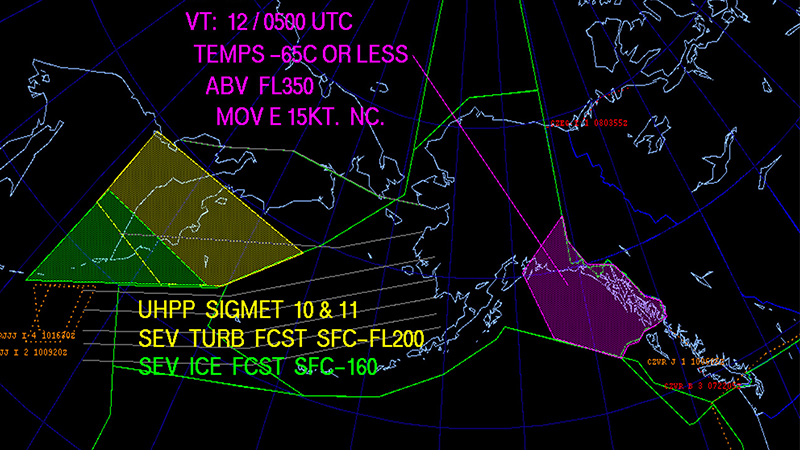
In December 2016, Weaver and other meteorologists in the Anchorage Center Weather Service Unit, housed in the FAA’s Air Route Traffic Control Center in Anchorage, started finding cold air cells in those snapshots and creating warnings, known as Meteorological Impact Statements, whenever atmospheric temperatures fell below minus 65 degrees Celsius. Meteorologists share those warnings with air traffic controllers who verbally inform pilots.
From December 2016 to March 2017, meteorologists tested their ability to predict cold air aloft with CrIS and ATMS. They predicted in February that a vast patch of cold air would persist for three days from 35,000 to 40,000 feet and stretch from northern Alaska to the Gulf of Alaska. Their forecast paralleled the actual sounding data captured by radiosondes in the area, giving meteorologists confidence in the technique’s accuracy.
In January, Alaskan meteorologists started a second three-month assessment of the cold air aloft data visualization tools. This time, it should be easier for forecasters to share the information with air traffic controllers, because it is displayed by flight levels instead of pressure levels, says Emily Berndt, a NASA research scientist.
If meteorologists in Alaska determine the cold air aloft data is useful, NASA researchers will prepare during the next couple of years to transfer to the National Weather Service the day-to-day responsibility for creating the cold air aloft visualization tools, and turn their attention to similar problems that could be solved or at least mitigated with satellite data.
For example, the NASA-NOAA team is developing tools to help meteorologists anticipate atmospheric convection. With satellite data, including a second set of CrIS and ATMS sensors launched in November 2017 on NOAA-20, forecasters also might be able to predict dangerous winter weather or wildfires both in the United States and internationally.
“The United States has a very robust network of ground-based sensors, radars and radiosondes, but the rest of the world does not have as many observations,” says NASA’s Zavodsky. “There are applications for these products around the globe with international partners, the World Meteorological Organization and even operational forecasters in other countries. We haven’t pursued that but it’s a longer-term vision.”
Teaming up
A large team of researchers is supporting NASA and NOAA’s effort to pinpoint regions of cold air aloft and develop software and displays to help air traffic controllers steer pilots to warmer skies. The team includes: NASA’s Short-term Prediction Research and Transition Center at the Marshall Space Flight Center
NOAA’s National Environmental Satellite, Data and Information Service
University of Alaska Fairbanks Geographic Information Network of Alaska
University of Wisconsin Cooperative Institute for Meteorological Satellite Studies
Colorado State University Cooperative Institute for Research in the Atmosphere; Science Technology Corp. of Hampton, Virginia
FUNDING: NOAA Joint Polar Satellite System
“We use this data to say, ‘Hey pilot, I know it’s 75 below where you are right now, but if you make a hard left turn and descend 4,000 feet you’ll be in much warmer air.’”
Eric Stevens, meteorologist at the University of Alaska