
Why are climate scientists so sure that our planet is in fact getting warmer? Adam Hadhazy went looking for answers.
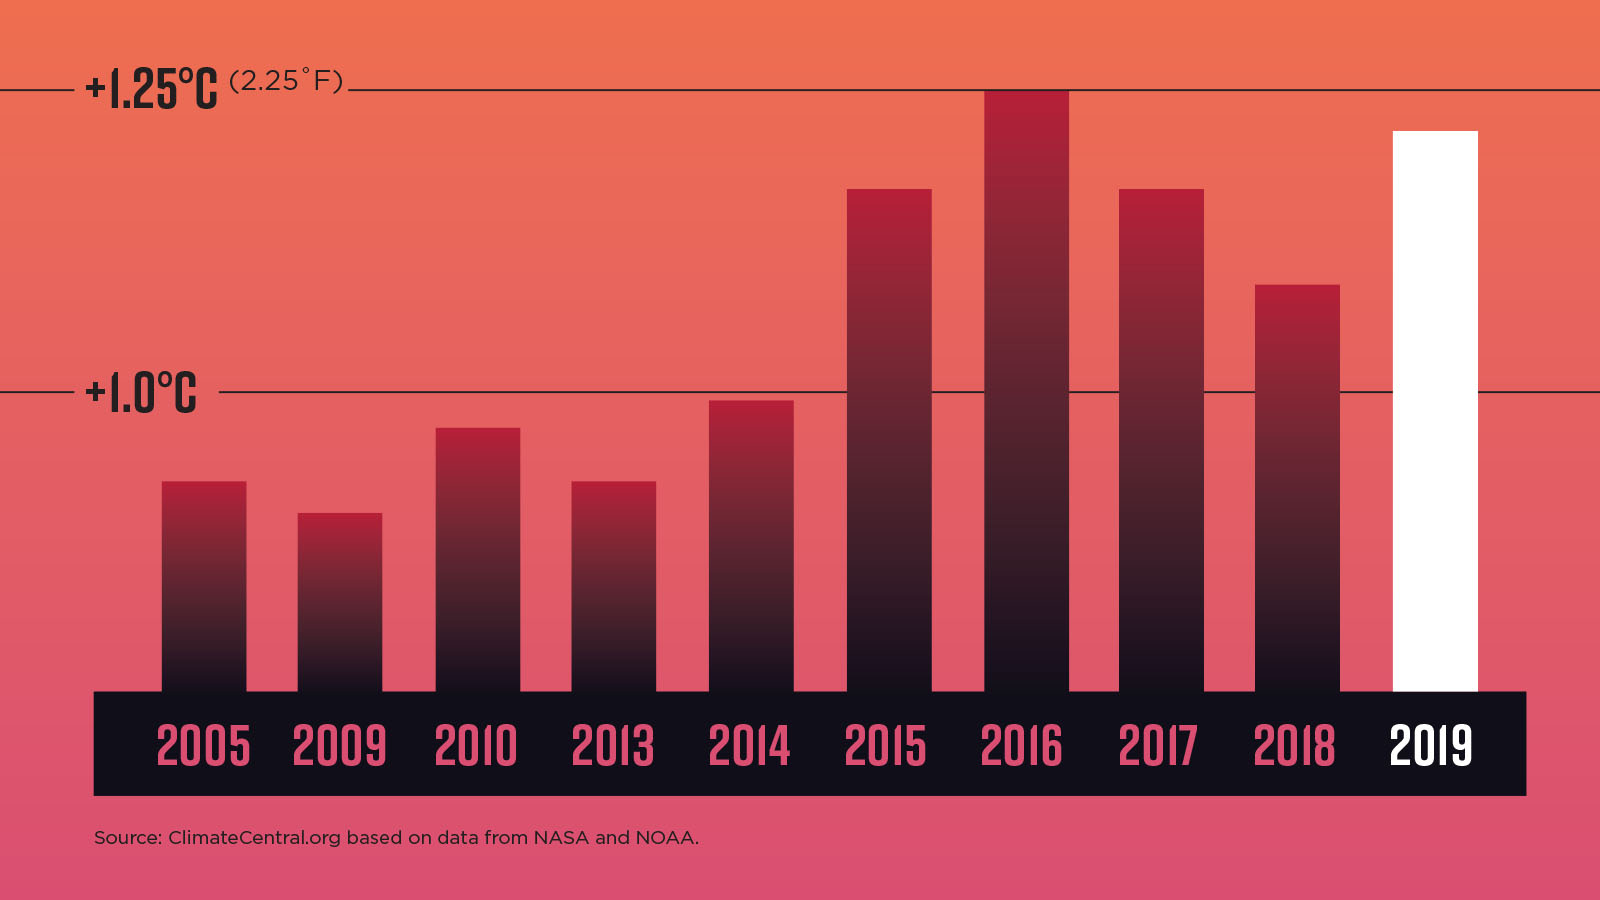
With an alarming frequency, the public keeps hearing that this or that year was “the hottest on record.” Almost true to form, NOAA and NASA in January announced that 2019 was the second-warmest year ever measured. In fact, nine out of the 10 hottest years in the era of instrument-recorded global temperatures dating back to the late 1800s occurred in the past decade. The drumbeat continues, with 2020 on its way to dethroning 2016 as the warmest yet on average across our planet’s surface.
For climate change doubters, the intricacies of attempting to take the global temperature are one reason to doubt the drumbeat, but for climate scientists, those intricacies are exactly why they speak of the annual records with such confidence.
To produce those headline-grabbing declarations, NOAA, NASA and equivalent agencies in other countries rely on datasets of global surface temperature measurements taken by electric thermistors and conventional thermometers on land and at sea. A focus on the planet’s surface is understandable, given that is, of course, where humans live, our crops grow, sea ice melts or freezes, and so on. Yet this ground- and sea-level record is hardly compiled in isolation. This data is just part of a cascade of millions of measurements gathered by sensors scattered around our planet, in its skies and in orbit. Temperatures are measured below the ocean’s swells, as well as throughout the atmosphere by airplanes and weather balloons. Satellites, meanwhile, also provide planetwide remote measurements of both surface and atmospheric temperatures. The result is overlapping and interweaving datasets, for both short-term weather forecasting and long-term climate monitoring and modeling. As it turns out, all these independent, deep repositories of temperature and related meteorological information agree with each other, buttressing each other’s validity.
“The strength of the systems, both for weather and climate, is that we’re not overly relying on any one sensor or a small number of sensors,” says Daniel Swain, a climate scientist at the University of California, Los Angeles. “Data is aggregated across many different types of sensors.” The upshot is that researchers are extremely confident about their findings. “It’s important to realize that in the climate community,” says Swain, “there really isn’t any disagreement on the overall reliability of the global temperature record.”
Every kind of measurement comes with its own set of caveats, limitations, potential biases and so on. But the strength in numbers helps weed out inevitable instrument-error outliers and smooths out gaps in temporal and geographical coverage. “There is obviously no individual sensor anywhere in any context that is perfect,” says Swain. “But as you aggregate up from individual locations, accuracy grows and errors decline because you’re using more data points.”
Assessing year-in, year-out
Numerous countries and research groups maintain their own global surface temperature datasets. The three most prominent are HadCRUT4, compiled by the United Kingdom’s Met Office Hadley Centre and the University of East Anglia’s Climatic Research Unit; the Goddard Institute for Space Studies Surface Temperature Analysis, or GISTEMP, from NASA; and NOAA’s closely related dataset, the NOAA Merged Land Ocean Global Surface Temperature Analysis, known as NOAAGlobalTemp. These datasets consist of tables of temperature anomalies for specific locations compared to the average for those locations over a reference era. For instance, NOAAGlobalTemp’s baseline period is 1971 to 2000, while GISTEMP’s is 1951 to 1980, and HadCRUT4’s is the pre-industrial period of 1850 to 1900. Researchers can’t simply average the temperature readings to produce these tables, because a host of factors could skew the average. Some weather stations are at higher, cooler elevations, for instance, and there are also clustering biases where there is oversampling in one region and undersampling in another. Statistical methods are applied to account for these potential biases and extrapolate from the individual data points. “So if it’s a little bit hotter in Montreal” than usual, “it’s also a little bit hotter in New York,” says Gavin Schmidt, director of the New York City-based Goddard Institute for Space Studies, which compiles GISTEMP. In fact, these anomalies “are very coherent over quite large areas of the planet,” he says. “You can use this large-scale coherence to put together a clear picture of how everywhere is deviating from their standard.”
Particularly challenging areas are the Arctic and Africa, “where there’s pretty sparse coverage,” explains Zeke Hausfather, director of climate and energy for The Breakthrough Institute, an Oakland, California-based environmental research center.
From these voluminous anomalies, scientists derive a single anomaly that describes the global temperature for the current year compared to a past baseline. Overall, the three sets have borne out that average global temperature has gone up about 1 degree Celsius (2 degrees Fahrenheit) over the past century-plus, with the majority of that warming having taken place over the past 50 years. Specifically, for 2019, the NOAAGlobalTemp dataset showed an anomaly of 0.93 degree C (1.67 degrees F), GISTEMP showed 0.98 degree C (1.76 degrees F), and HadCRUT4 showed 1.05 ± 0.1 degrees C (1.89 degrees F), from each dataset’s baseline. Such findings form a key part of the climate change projections and impact assessments conducted by the Intergovernmental Panel on Climate Change, or IPCC, the United Nations body that publishes authoritative reports representing the combined work of thousands of climatologists around the world. The IPCC has warned that policymakers must try to constrain warming to less than 2 degrees C over pre-industrial levels to avert some of the consequences of global warming including sea-level rise, altered precipitation patterns, and food and water scarcity.
Data quality and quantity
The global surface temperature datasets are merged datasets of land and ocean temperatures. Those underlying land and ocean datasets change over time as new temperature measurement sources are added, for instance, or researchers hone their data analysis methods. As an example, the latest version of the land station dataset relied on by NOAA and NASA offers improved geospatial coverage by compiling measurements from 26,000 weather stations around the world, versus around 7,200 stations for the previous version. As an indication of the sort of honing researchers employ as they aim to improve the accuracy of such a dataset, only land stations that have records spanning at least 10 years are counted. Having multiyear records enables researchers to account for potential data-skewing changes that can occur at a given station, such as upgrades in instrumentation that could shift temperature readings, or land use changes around a station, like the swapping of cooling tree cover for a temperature-raising asphalt parking lot, and so on. The oceanic temperature dataset likewise undergoes changes. For instance, its latest version builds in new data releases from a database of records gathered daily by merchant, fishing, research and navy ships. There is also new data regarding near-surface temperature measurements provided by floats, along with a new estimate of sea ice concentrations, important for reconstructing temperatures where measurements are not directly taken.
These various underlying observational and collection methods are just a sampling of the many global temperature models compiled worldwide by governments, universities and research organizations. Small differences naturally emerge among the multifaceted and heterogeneous datasets, but across the board, the story they tell is the same: The planet is warming. “Different methods are tested every which way, all around the world independently, using different measurement systems, and they all give you the same answer,” says Schmidt.
The small differences depend partly on how analysts deal with geographic limitations. Some groups leave out remote regions where weather stations are in short supply or nonexistent and instead offer a global temperature average for, say, 85% of the planet. Other groups interpolate to fill those gap areas, based often on the nearest weather stations, to produce full-planet maps.
In plugging those gaps, as well as crosschecking weather station temperature reports, Hausfather says that numerous other meteorological and climatic variables, such as atmospheric pressure, humidity and cloud cover, are taken into analytical consideration. Because these variables correlate, if temperature data is missing for a certain area but there is, say, pressure data, a demonstratively accurate weather model that had gotten the forecast right can backfill in the missing temperature data with high confidence. Supercomputers crunch the voluminous data to churn out these predictive models for not just next week’s weather forecast, but also for reproducing old climate records, as well as prognosticating the climate yet to come.
Over the years, temperature collection methods have become more precise. In some cases, records go back to the mid-19th century, although the early measurements are very sparse and far less reliable than today’s. Thermistors have become the modern standard, though mercury-based thermometers can still be found at some ground stations, which in the U.S. can be volunteer operations run out of someone’s backyard. Oceangoing vessels are now also equipped with more sophisticated instruments. “We’ve come a long way from throwing buckets off of the side of a ship and then sticking a thermometer in,” says Hausfather.
Degrees at sea
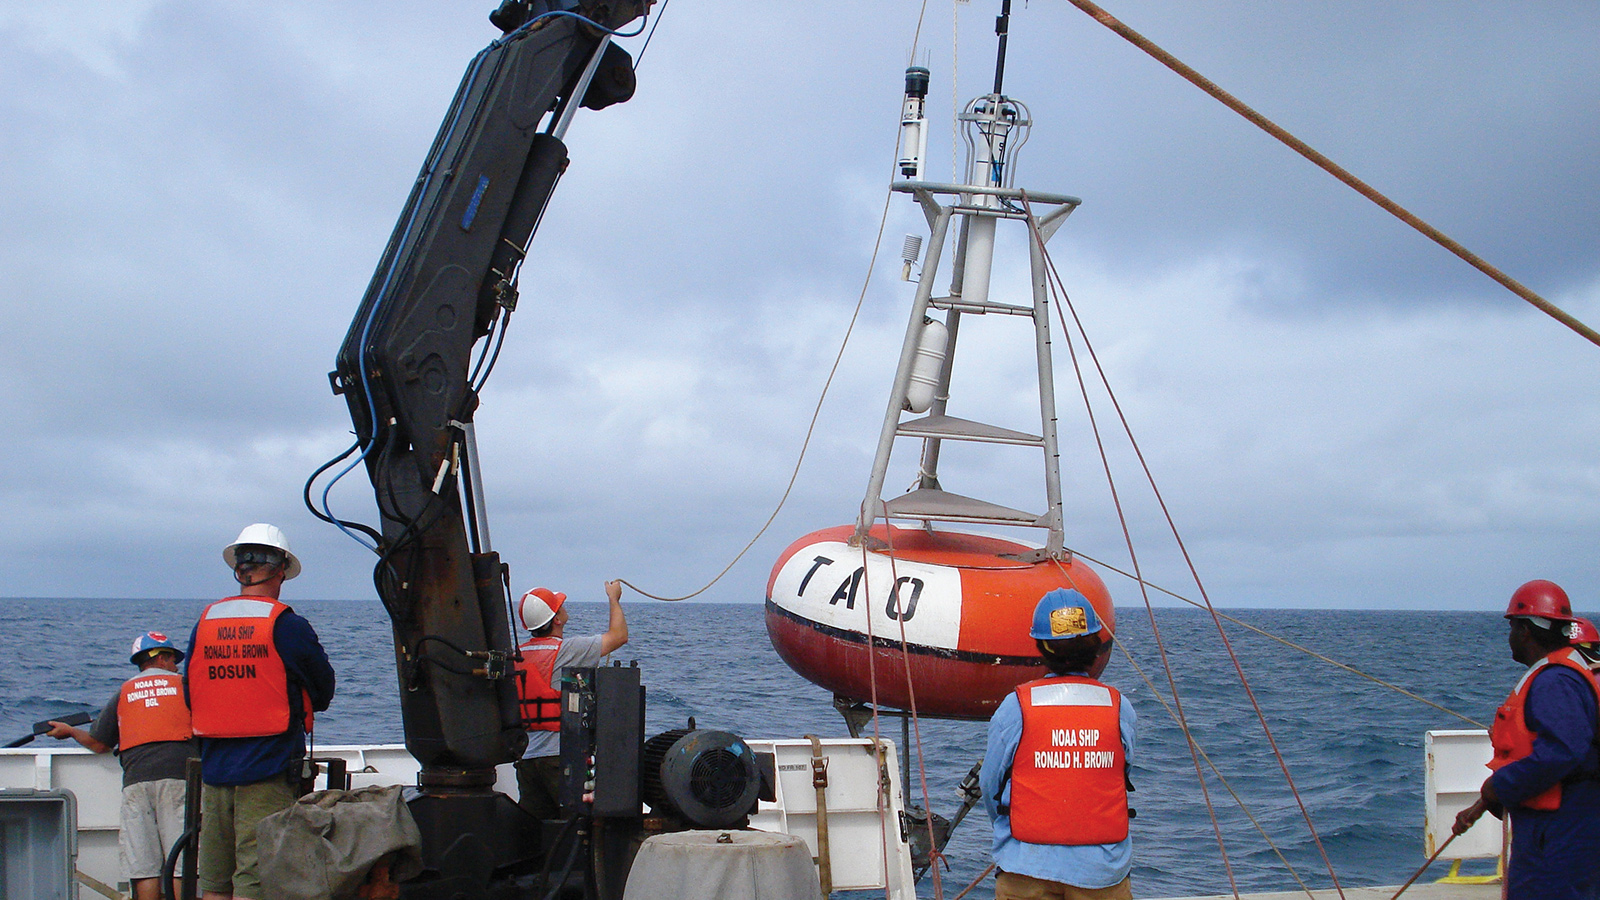
Compared to ships, which offer data quantity but tend to cluster in commercial sea lanes and closer-to-shore fisheries, buoys have vastly expanded the reach of quality temperature data across the world’s oceans since their deployment began in the 1980s.
One such buoy network is the Global Tropical Moored Buoy Array, consisting of about 100 moorings deployed as three separate arrays in the equatorial oceans. These arrays gather data for short-term, big-impact meteorological phenomena, such as El Niño warming events in the Pacific, hurricanes in the Atlantic and the rise of the Indian Ocean monsoon, as well as longer-term data for climate modeling.
The buoys are tethered to the ocean floor and stick about 5 meters above the waves, atop an inner-tube-like flotation ring. The temperature sensors on the buoys are tried-and-true devices called platinum-100 resistance temperature recorders, with error ranges of plus or minus 0.2 degree C from actual. This sort of precision is needed for distinguishing long-term climate trends, which are subtle compared to the vagaries of daily temperature. “Climate variability is weaker than weather variability,” says oceanographer Michael McPhaden, senior scientist at NOAA’s Pacific Marine Environmental Lab in Seattle and director of the Global Tropical Moored Buoy Array. “To pull out the climate signal from this highly energetic background of weather noise, you need highly accurate measurements.”
Powering the individual buoys’ meteorological sensors, plus data logging and transmission, are anywhere from 120 to 265 1.5V alkaline D-cell batteries like those in flashlights. Data transmission previously relied on the seven, polar-orbiting Argos satellites, operated originally by NOAA, NASA and CNES, the French space agency, deployed in the late 1970s. The data was forwarded to weather and climate modelers on land when the satellites came into view, between six and eight times a day. Nowadays, as a boon for forecasters, most of the buoys transmit data hourly through the 66-satellite Iridium NEXT constellation.
A similar switchover from Argos to Iridium has taken place for a separate network of ocean thermometers aboard the 4,000 Argo floats, so named because they gather data concurrently with sea-surface-height readings from the NASA-European Jason satellites, named for the character in Greek mythology whose ship was Argo. Scientists came up with the Argo concept over lunch about two decades ago during a Jason planning meeting at the National Center for Atmospheric Research in Colorado, recalls Argo Director Breck Owens of the Woods Hole Oceanographic Institution in Massachusetts. Where Jason-1 found rising seas, it would be important to know how much of that effect was due to warmer water below the surface. To find out, each meter-long cylinder drifts below the surface and ascends at intervals by pumping oil from an internal reservoir into an exterior bladder. Once at the surface, each float uploads data to satellites. The switch to Iridium has been a boon, because now the floats only have to stay at the surface for minutes instead of hours, which reduces their exposure to surface currents and provides less opportunity for barnacles and phytoplankton to grow. The Argo network provides coverage down to thousands of meters and from the Arctic to the Southern Ocean. Data for the top 5 meters is fed into the newest version of the oceanic surface temperature dataset incorporated into GISTEMP and NOAAGlobalTemp for annual Earth surface temperature calculations, significantly boosting comprehensiveness. “They’re awesome little robots,” says Hausfather.
Taking the heat on high
Satellites, of course, can do far more than just ferry climatic data gathered by sensors. They’ve emerged themselves as powerful tools for climate monitoring, providing crucial crosschecks on the ground- and ocean-based databases of record, as well as compiling their own growing and increasingly calibrated trend lines. The two most common temperature-measuring methods from orbit involve radiometers that measure infrared radiation emitted by sea and land surfaces, or microwaves emitted by gases in the lower atmosphere.
The Joint Polar Satellite System, or JPSS, the latest in a long line of NOAA polar-orbiting weather satellites dating back to 1960, carries both kinds of instruments and others on the two satellites deployed to date. The JPSS satellites follow a sun-synchronous orbit so that they cross northward over the equator always in the early afternoon (about 1:30 p.m. local time) a total of 14 times during the span of 24 hours. In these early afternoon orbits, they accumulate readings for the full planet twice a day. NOAA’s Mitch Goldberg, chief program scientist for JPSS, says the trick to accessing the collected data promptly to inform weather forecasting models is for the satellites to perform downlinks to antenna farms near the poles, where the sats cross over with every orbit. One such station is in Norway’s Svalbard archipelago, some 1,050 kilometers away from the North Pole, while the other is at McMurdo Station in Antarctica, about 1,360 km from the South Pole.
The fact that the two JPSS satellites are in identical orbits just 15 minutes apart and carry the same generation of sensors helps deal with orbital drift, a major calibration challenge with sensitive climate monitoring. As a satellite’s orbit decays, its crossing times over specific locations change, potentially scrambling long-term record keeping. “Say right after launch, a satellite starts flying over San Francisco at noon,” says Hausfather. “Then in a few years, the satellite’s now flying over San Francisco at 1, 2, 3 or even 4 p.m. You measure the temperature at noon versus 4 p.m., you’re going to get a fairly different reading.”
Goldberg says that the JPSS satellites can cross-check against each other, “giving us confidence that the instruments are behaving well” and validating other accumulating logs of temperature trends. “When satellite data is not really used in climate models, it can be used to verify those climate models,” says Goldberg.
An ever-fuller picture
Commercial aircraft serve as another critical data source for local and regional weather forecasting models, which aid in further honing the numerical models likewise developed for longer-term climate modeling. All flight long, passenger and cargo jets send temperature, pressure, humidity and other meteorological readings of interest to the National Weather Service. Takeoffs and landings in particular offer detailed data on the vertical structure of the atmosphere, which in turn assists with gauging thunderstorm likelihood, among other payoffs. “Ascent and descent are the most valuable,” says Swain.
With the novel coronavirus pandemic having grounded about 75% of domestic flights in the United States for weeks on end, according to NOAA, and upward of 90% of flights elsewhere in the world, meteorologists have been concerned these sudden holes in local data might negatively impact weather forecasting. NOAA has started launching more weather balloons, bringing the daily total closer to 200, but their measurement sets pale in comparison to those provided by the full fleet of 3,500 equipped domestic aircraft. Into this breach can step satellites, both those satellites intended for short-term weather grabs and longer-term climate record keeping, shoring up the data stores on hand. “One observing system compensates for the other,” says Goldberg.
Overall, it is both this independence and inter-dependability of the mosaic of temperature measurements that assures the broad community of scientists they have a solid handle on an ever-changing but tractable phenomenon. That goes both for the 10-day forecast — uplifting or depressing, depending on one’s weather preferences — as well as the 100-year climatic outlook, which is squarely dire.
“The trends are becoming ever more clear and obvious to everybody that looks,” says NASA’s Schmidt. “We’re in a very, very strange place climatically.”
“Different methods are tested every which way, all around the world independently, using different measurement systems, and they all give you the same answer.”
NASA’s Gavin Schmidt