Seeing inside storms from space
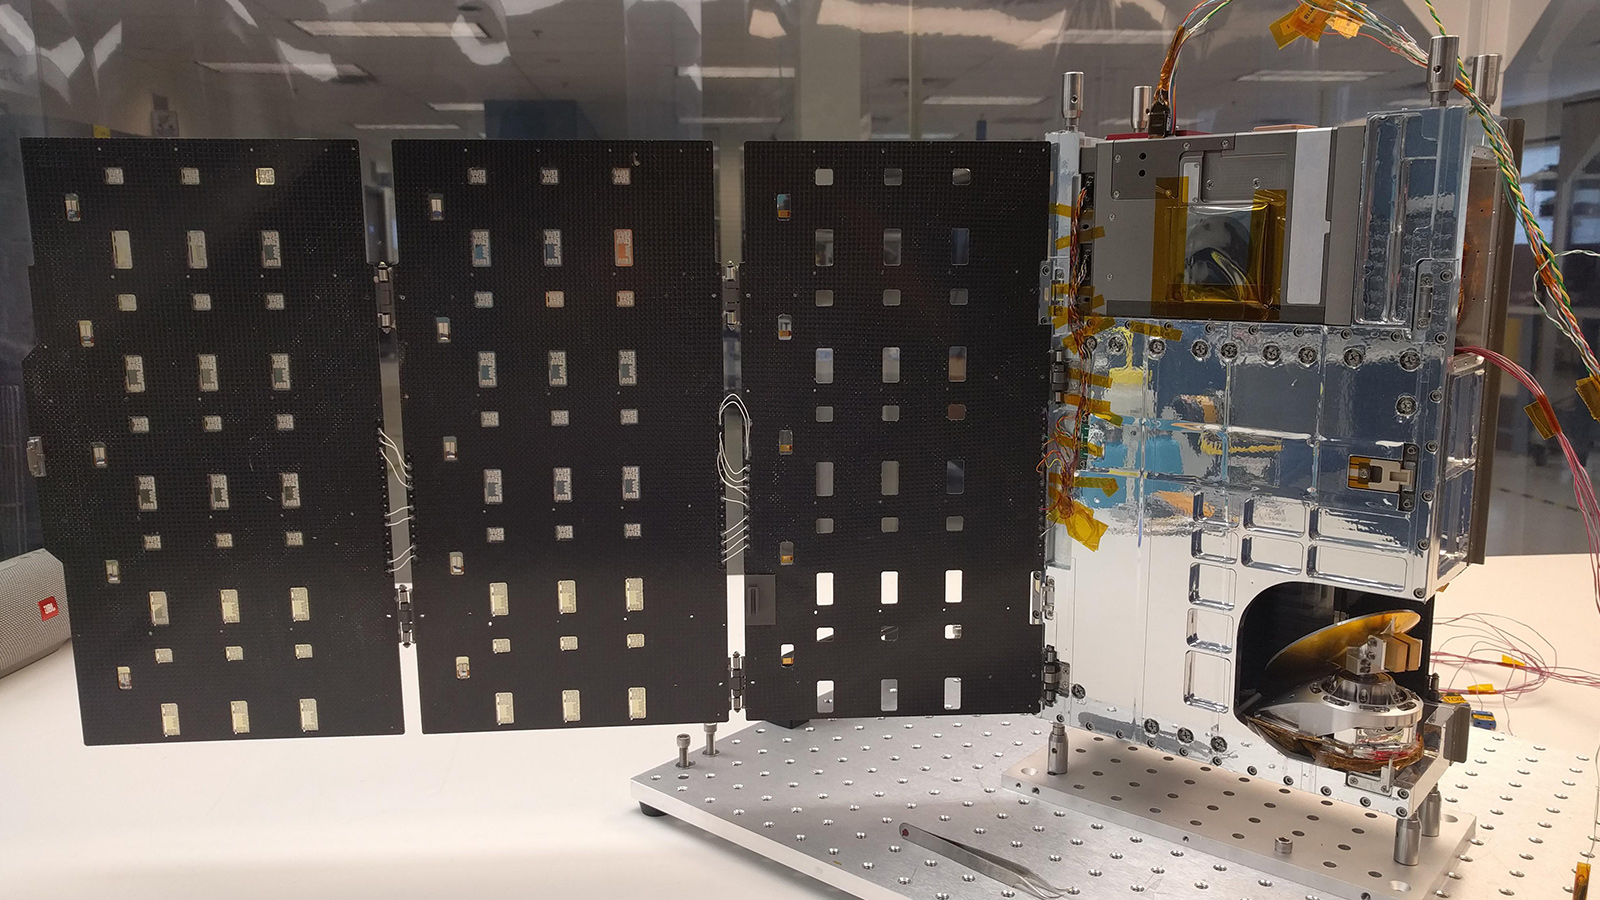
Lots of weather data comes from government satellites as large as pickup trucks, but when it comes to depicting the structure of storms, a cubesat the size of a cereal box is proving bigger isn’t necessarily better.
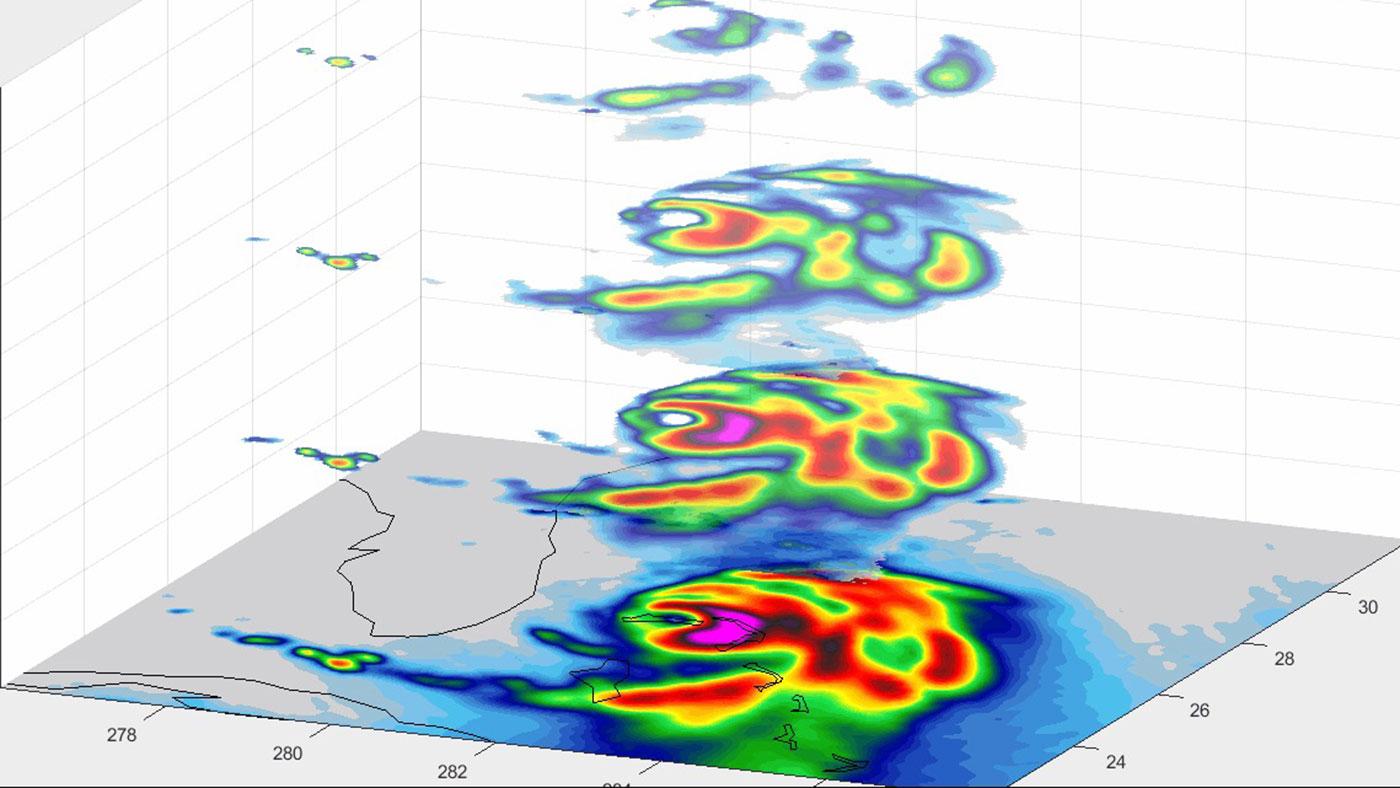
The 11-kilogram cubesat TEMPEST-D, short for Temporal Experiment for Storms and Tropical Systems-Demonstration, gave government scientists and university researchers an interior view of Hurricane Dorian after it destroyed parts of the Bahamas in early September. By measuring the amount of water vapor within the clouds and other factors, TEMPEST-D showed where the rainfall was heaviest within the storm’s structure.
“It’s pointing the way toward a future that we believe could change weather forecasting,” says Steve Reising, the principal investigator for TEMPEST-D and a professor of electrical and computer engineering at Colorado State University.
For now, TEMPEST-D’s data is strictly experimental, but the data it has collected from Hurricane Dorian and other storms are publicly available to atmospheric researchers.
TEMPEST-D was designed to track the progression of storms. Inside the six-unit cubesat is a miniaturized microwave radiometer built by NASA’s Jet Propulsion Laboratory in California. These sensors measure the wavelengths from thermal electromagnetic radiation that atmospheric gases emit. The radiometer on TEMPEST-D detects those wavelengths at five frequencies, “penetrating into the cloud and looking at different depths” of a storm, Reising says.
“You want to see the storm as it develops vertically and what’s going on in the environment around it when the storm forms,” Reising says.
From its orbit of 400 kilometers, the cubesat is closer to the wavelengths emitted from storms like Dorian than the U.S. geostationary satellites positioned about 36,000 km above the equator. “So therefore, if we move a hundred times farther away, we’d have to have a hundred times larger antenna,” Reising says.
At a fraction of the size and cost of other weather satellites, cubesats could mean “more frequent observations of the same storm at the same cost,” Reising says. The TEMPEST-D project, started in August 2015 and funded by an $8.2 million grant from NASA’s Earth Venture Technology Program, took about 2½ years from development to launch.
The spacecraft, which was built and assembled by Blue Canyon Technologies in Colorado, has been in orbit since July 2018. Reising expects the mission to continue until mid-2021, at which point atmospheric drag will pull TEMPEST-D into the atmosphere to burn up from the friction.
But the journey might not end there. The CSU team wants to capitalize on TEMPEST-D’s success with a constellation that would supply microwave data to not just scientists but to weather forecasters. Reising envisions the constellation, which would be named TEMPEST, as a line of cubesats trailing one after another in orbit, sampling the changes in clouds and surrounding water vapor every three to four minutes for about 30 minutes.
“For any one storm, most will be seen by one satellite once per day,” he says. “The idea of a train of satellites is the first satellite will see the storm, and then boom, three or four minutes later the next satellite comes along to capture that same scene and so on.”
In the current concept, TEMPEST would be comprised of six to eight cubesats, but the constellation could be expanded to “as many as make sense,” Reising says.