
Decoding the boundary layer at hypersonic speeds
Next May, if all goes as planned, a sounding rocket will soar to an altitude of nearly 300 kilometers over a test range in Sweden, and as it descends it will accelerate to a hypersonic speed of Mach 7 to 7.5. A nearly meter-long metal wedge on its tip will gather hundreds of aerodynamic measurements for the U.S. Air Force Research Lab.
U.S. engineers hope that this experiment called BOLT, short for Boundary Layer Transition, will tell them when the thin layer of air flowing smoothly over the surface of the wedge turns turbulent, and where on the shape this transition begins.
“If you’re actually trying to make something that flies, you should know that, right?” says AFRL’s Ivett Leyva, the BOLT project manager and creator.
An unexpected transition to turbulent flow risks overheating a future hypersonic vehicle, so designers need the ability to predict when and where this will happen on a vehicle’s shape. BOLT’s wedge shape, however, is not meant to represent any particular vehicle. This is a $6 million basic research project that includes the $2.4 million flight in Sweden.
BOLT is an example of the basic research that underlies a multibillion-dollar U.S. initiative to catch up to a perceived lead by China in hypersonics and what the U.S. views as Russia’s more dubious claim that it has already fielded hypersonic weapons.
Hypersonic weapons might be propelled by air-breathing supersonic combustion ramjets, known as scramjets, or by rockets accelerating through space before returning to the atmosphere in a “boost-glide” design. Verified, maneuverable hypersonic weapons would be formidable: faster than the fastest bullets in the world and seven times faster than most cruise missiles.
The U.S. until now has muddled through in the hypersonic realm without firm data about the boundary layer transition. “If you have uncertainty on how hot your flying object is going to get, you have to think how you’re going to survive with that uncertainty,” explains Leyva.
When engineers can’t accurately predict the transition to turbulent flow, they must design conservatively. This was the case with the space shuttle orbiters. Each was protected during reentry by heat-absorbing tiles designed to withstand greater heat than was probably necessary. The concern is that swirls in the turbulent flow mix the boundary layer air much more than the smooth, laminar flow occurring before the transition. This mixing drags more high-speed flow close to the surface, which creates a lot more friction and up to eight times the heat created by laminar flow.
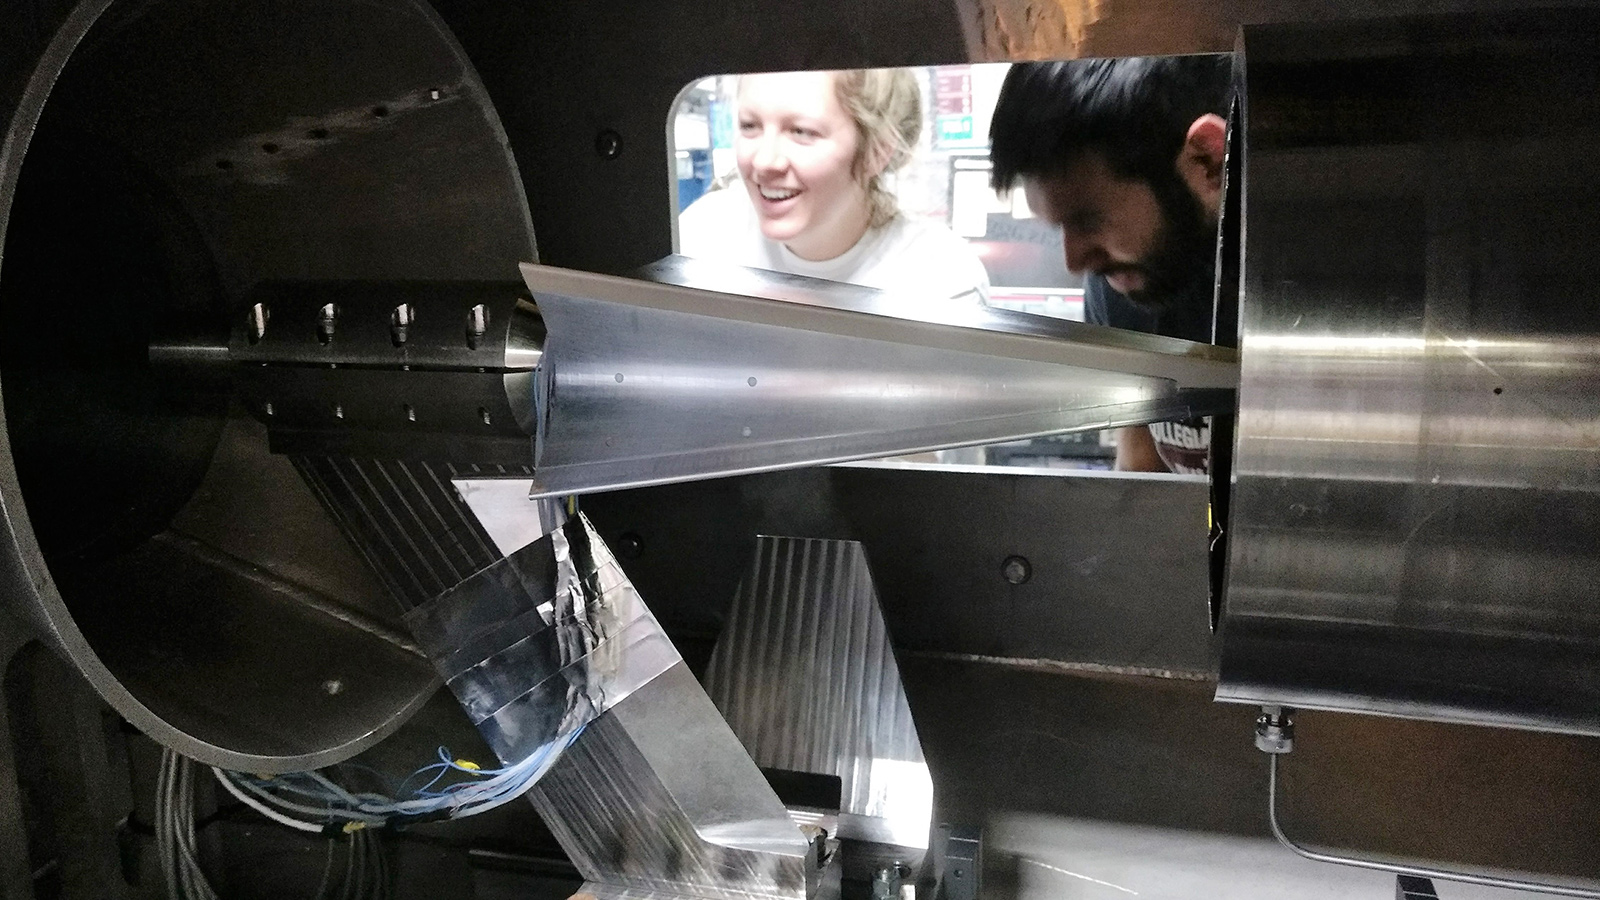
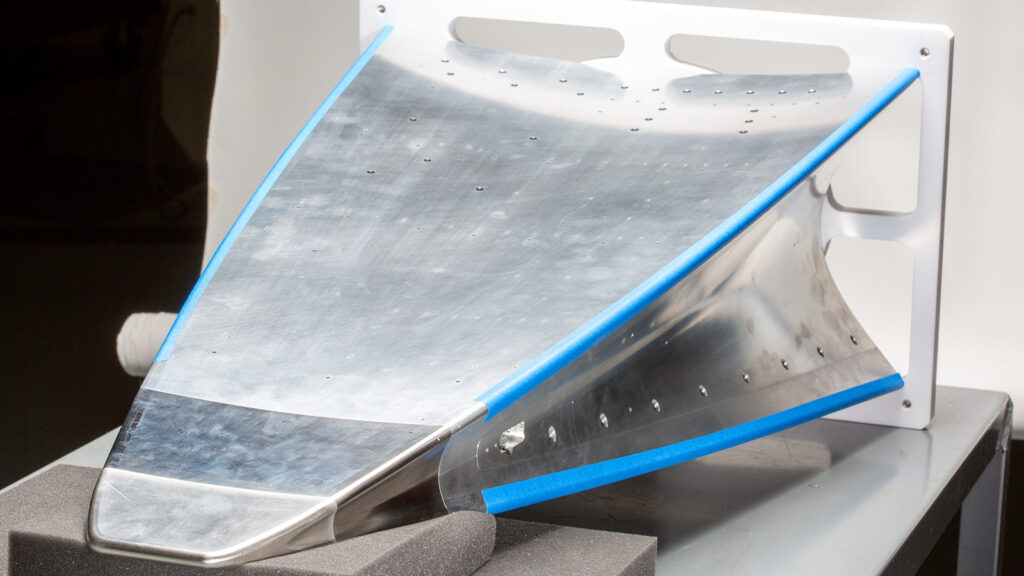
The wedge is 87 centimeters long with a snub nose, swept leading edges and slightly concave surfaces. This shape presents more aerodynamic challenges than the cone and elliptical-cone tested under a previous U.S.-Australian effort called HIFiRE, short for Hypersonic International Flight Research Experimentation.
The location of a boundary layer transition varies with a large number of factors, including the vehicle shape, altitude, orientation of vehicle, materials of the vehicle, its surface texture, temperature of the surface, Mach number and Reynolds number, which is the ratio of inertial forces to viscous forces in the air flow. Generally, the higher the Reynolds number, the greater the likelihood of turbulent flows. The effect of the Mach number is not as clear-cut, says aerospace engineer Dennis Berridge, the BOLT co-investigator from Johns Hopkins University Applied Physics Laboratory.
One challenge facing the BOLT team was that no single wind tunnel facility could reproduce every aspect of the flight environment. Some tunnels are “quiet,” meaning their walls exhibit smooth laminar flow, but they can provide only one velocity of hypersonic flow and accommodate only small shapes. Some tunnels that can test larger shapes provide only a few milliseconds of flow.
The team decided it would need to test multiple versions of the wedge, made from metal or plastic in several sizes, in multiple tunnels and “stitch together what would happen in flight,” Berridge says.
Engineers were also concerned about the risk of noise, meaning disturbances caused by the tunnel walls. So they tested some shapes at the quiet tunnels at Purdue University and Texas A&M. Other tests were conducted in Buffalo, New York, at the research company CUBRC (formerly the Calspan-University at Buffalo Research Center) and at NASA’s Langley Research Center in Virginia.
These facilities can accommodate larger models at full-flight velocity but with noise from the turbulent flow along the walls, Berridge says.
Stitching all these measurements together was helpful but imperfect. That’s why the May flight test will be so important, Leyva says.
“There’s not a single wind tunnel that we’ve dreamt of and built that can catch all of these requirements and give us good flow. It just doesn’t exist. So we have to fly,” she says. “It’s just the natural environment where you want to understand the physics.”
Another challenge for the scientists has been how to measure the boundary layer flows. Two measures signal when laminar flow is transitioning to turbulent flow: heat and pressure variations.
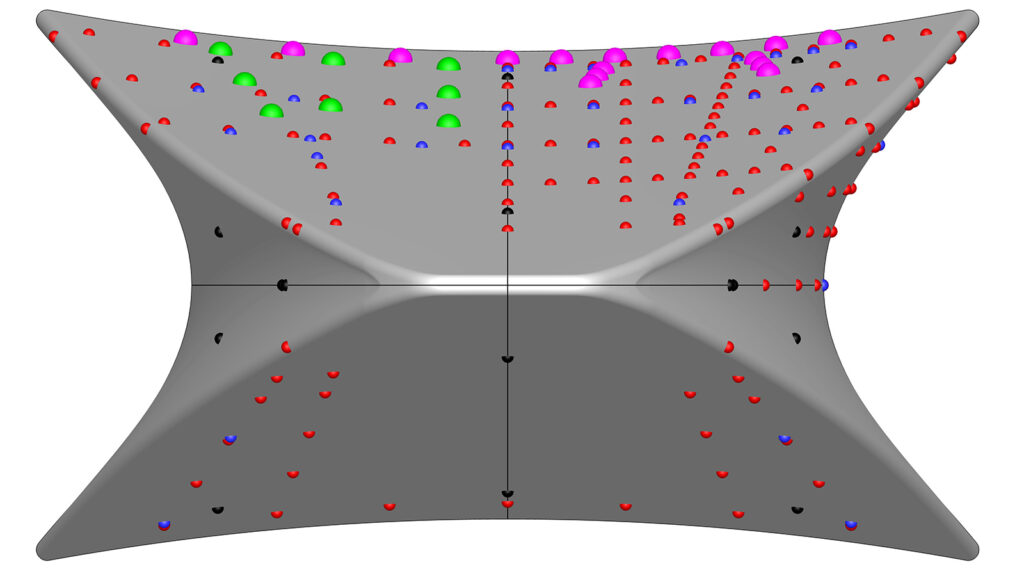
To measure pressure, the engineers drilled 3-millimeter holes in the BOLT wedge shape for small cylinder-shaped pressure sensors, inserted from the inside of the shape to be flush with the surface of the shape, with the sensing surface exposed to the air flowing over the shape.
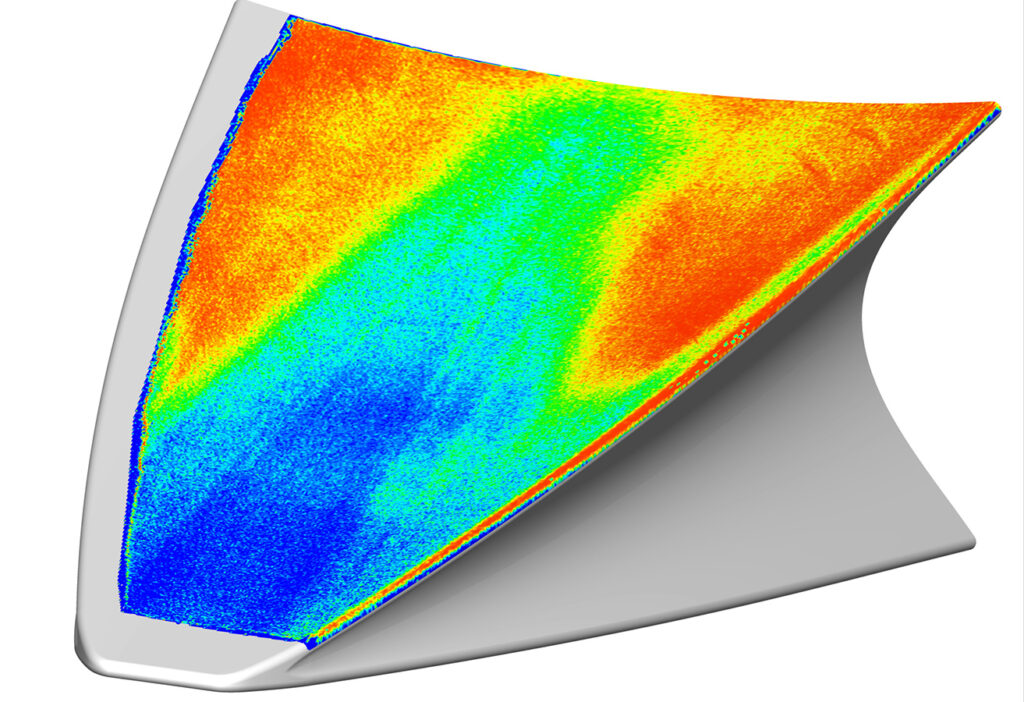
To measure heat, the engineers pointed infrared cameras at the model to detect where the temperatures started rising, indicating potential transitional flow. They also painted some of the models with temperature-sensitive paint, excited the molecules in the paint with blue light, then pointed a camera at the model to detect temperatures shown by color variations in the paint.
AFRL contracted with the German aerospace agency, DLR, to launch the test shape — made of aluminum, a titanium-zirconium-molybdenum alloy and stainless steel — on the 8.4-meter sounding rocket. As for the status of the preparations, U.S. scientists have built the hardware for the flight experiment and should have the instrumentation built for measuring the test by October.
The test will be at the Esrange Space Center in Sweden, chosen by DLR so the rocket can be retrieved on land. The AFRL will provide electronics for the rocket, borrowing from electronics it developed with Australia for the HIFiRE flights.
Engineers will collect 340 measurements of temperature, pressure and heat transfer as the wedge accelerates to a maximum hypersonic velocity of somewhere between Mach 7 and Mach 7.5 after it reenters the atmosphere. At that point, the rocket’s tip and wedge will separate and fall to the ground about 60 k down range. Some data will be transmitted during the experiment, and the rest will be collected from a hard drive in the tip after it is recovered.
Preparing for the flight test and potential things that could go wrong puts a lot of pressure on the team, says Brad Wheaton, APL aerospace engineer and BOLT principal investigator. “It’s a one-time shot. That’s what makes hypersonic testing exciting.”
The BOLT experiments are breaking new ground for hypersonics knowledge, and scientists will be studying and interpreting the test results for many years as they build on the BOLT research findings, just like scientists are still studying HIFiRE results 10 years later, Leyva predicts. “We feel pretty good that we can digest the differences that we have seen so far from this to the other simpler geometries. We kind of understand why they’re different,” she says. “Now we are going into this way more complex geometry, and we are getting way more complex physics. We are not in the business of doing things just to validate computer models; we are in the business of creating an understanding of physics. We are in the business of creating new science.”
Once they launch their wedge-shaped structure to hypersonic speeds and recover it, engineers from the U.S. Air Force Research Lab will move onto their next flight experiment in which they plan to launch an elongated version of the wedge to hypersonic velocities.
This Boundary Layer Transition II wedge will be launched on a sounding rocket sometime in 2021 from NASA’s Wallops Flight Facility in Virginia. The elongated BOLT II wedge is designed to create more hypersonic turbulent flows than the original BOLT wedge that in May 2020 will soar over a test range in Sweden, if all goes as planned.
The BOLT II project was started on May 1, and hypersonic wind tunnel testing is underway at Texas A&M in College Station, Texas.
BOLT II is expected to be similar in scope and cost to the $6 million BOLT project, with testing at several hypersonic wind tunnels leading up to the flight test, says AFRL’s Ivett Leyva, creator and manager of BOLT and BOLT II. Leyva is still assembling the project teams. BOLT II may also incorporate new types of instrumentation to measure factors in addition to the temperature and pressure variations examined by the BOLT team, Leyva says.
-— Keith Button