Bad vibrations
When a vehicle reaches hypersonic speeds of Mach 5 or greater, pressure fluctuations in the air flow can zip across the surface within the otherwise smooth laminar flow. These turbulent spots can grow and conglomerate into an unsteady turbulent layer that vibrates the vehicle. If the structural loads from these vibrations are strong enough, they can damage the vehicle and any sensitive electronics or payloads inside it.
With U.S. development of hypersonic systems now a top defense priority, and private companies determined to one day create hypersonic passenger aircraft, the need to understand exactly how much vibration is imparted by these turbulent spots has become even more pressing. Engineers must be able to predict where turbulent spots will form and anticipate the intensity of the resulting vibrations and loading.
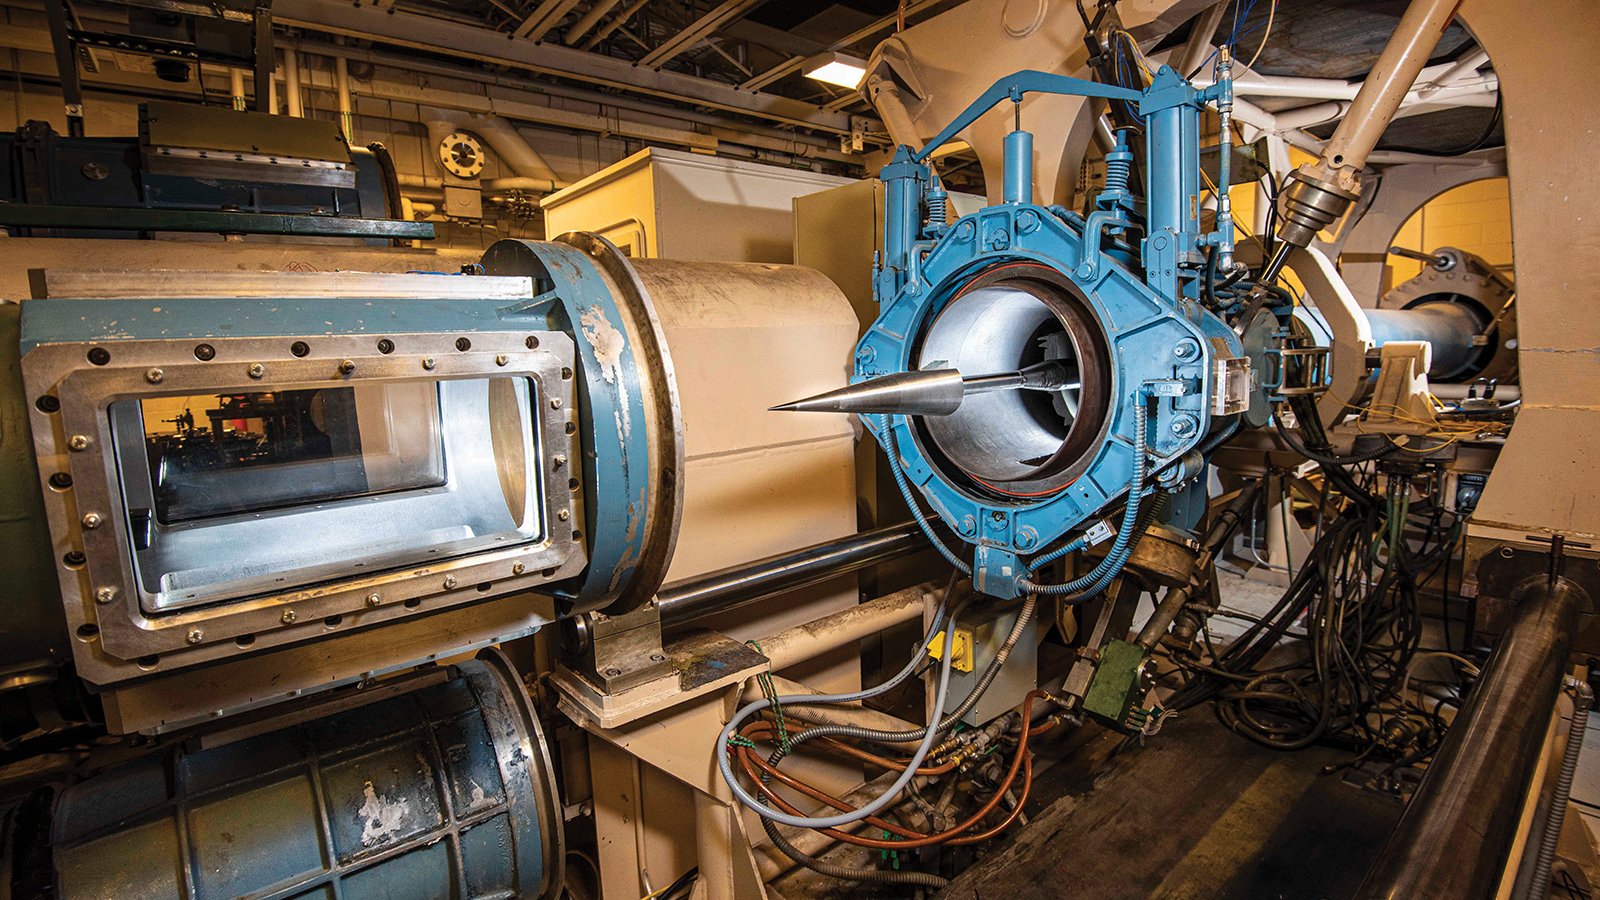
The origins of turbulent spots and the resulting structural response have been understood in low-speed flows for many years. But they are known to be driven by differing physics in hypersonic flows. This was the void my colleagues and I continue to pursue filling under a research initiative begun in 2007. The experiments began at Purdue University during my graduate studies and then moved to the Hypersonic Wind Tunnel at Sandia National Laboratories in New Mexico.
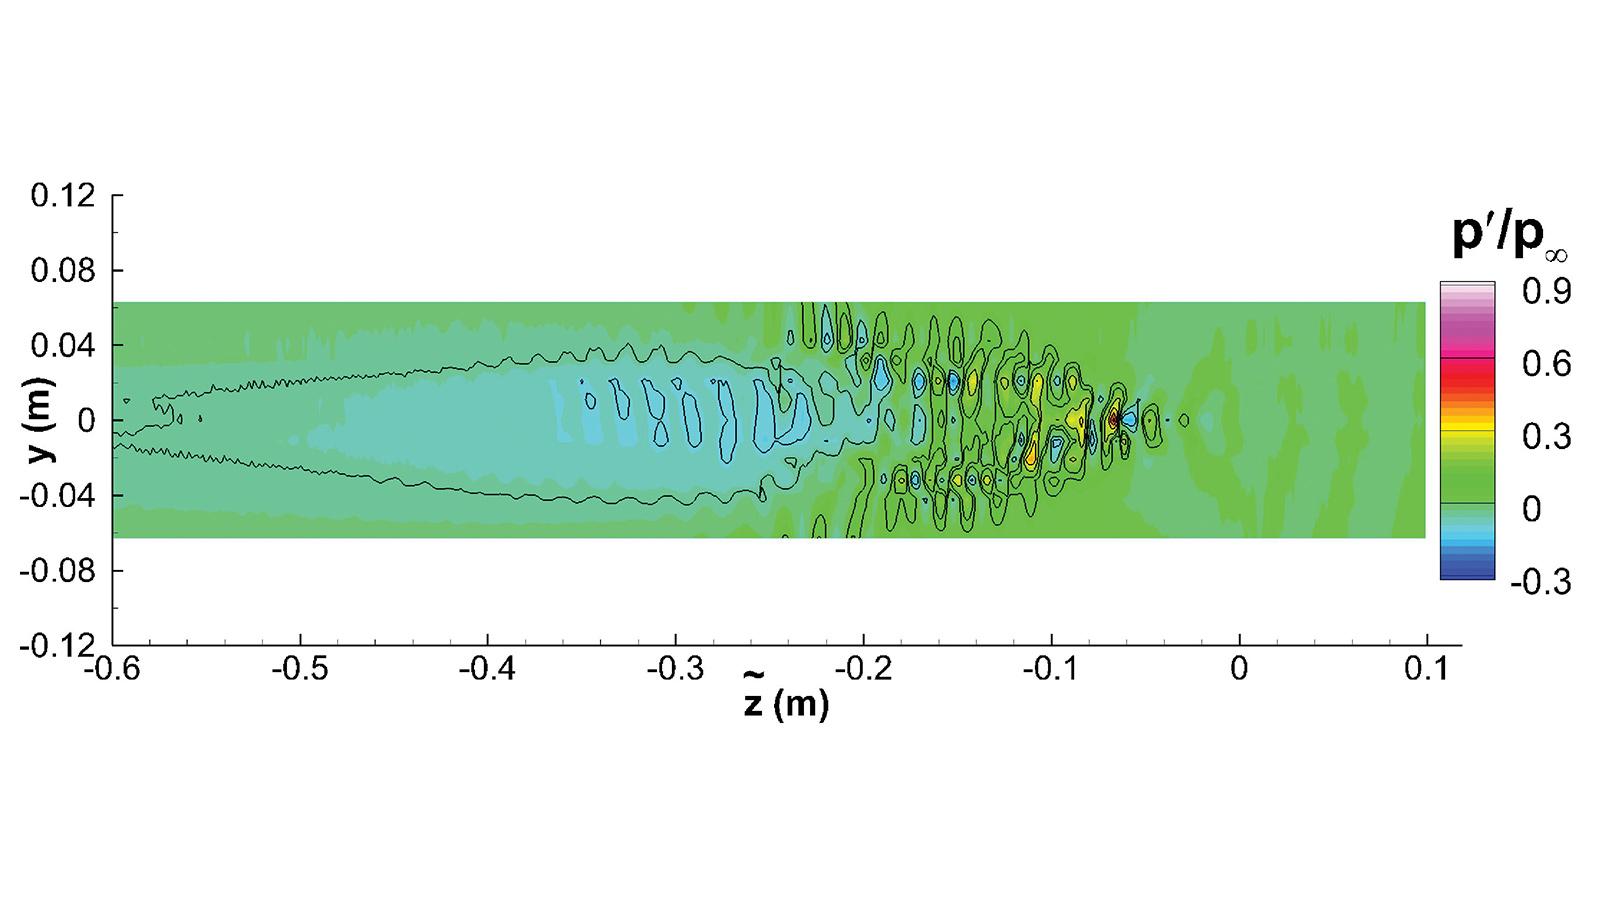
At Purdue, we started out mapping the pressure field beneath a single hypersonic spot to contrast its behavior with the pressure field of a low-speed turbulent spot. We did this by installing arrays of pressure instrumentation on the wind tunnel wall in order to study the development of a large spot over several meters. A traditional wind tunnel model would not have been the right choice at this point in the project. The models are typically only a half meter long, so the spots that form on those models are too small to map the pressure fluctuations beneath them with high spatial resolution.
With the pressure measurements from the tunnel wall obtained at a rate of hundreds of kilohertz, we characterized how a single spot formed from hypersonic instabilities in the boundary layer. For the first time, the shape and magnitude of a hypersonic spot pressure field was mapped. This mapping showed that the hypersonic instabilities were an integral part of the spot at these high speeds, and these instabilities persisted at the edges of the growing disturbances.
We then needed to study the physics of how these instabilities break down during transition from laminar flow to form turbulent spots and understand how those physics differ between low and hypersonic speeds. This transitional breakdown can be a prime contributor to unsteady loading and vehicle vibration. We needed to measure spot growth and propagation on a relevant geometry, specifically a cone-shaped wind tunnel model that is representative of many hypersonic vehicles. We installed dense arrays of high-frequency pressure instrumentation on a model that traveled between the Purdue and Sandia tunnels in a collaborative research effort. We also visualized the density gradients in the flow over the model with high-speed cameras using a technique called schlieren imaging. With both the pressure measurements and flow visualization, we detected turbulent spots passing over the models in milliseconds and captured the spot evolution as it developed from the breakdown of hypersonic instabilities.
Ultimately, for our flight predictions, we need to know the statistics and distribution of how these spots form as the boundary layer transitions from smooth laminar flow to unsteady turbulence. The spot formation rates and distributions were measured over a range of conditions between Mach 5 and Mach 14. With this data and the pressure mapping beneath a single spot, Sandia was able to develop computational models of the pressure loading on a hypersonic vehicle during transitional flow.
With a physical basis established for the behavior of hypersonic turbulent spots, we began to contemplate how a structure on a flight vehicle might respond to their passage. We decided to start with a very simple geometry. A 1-millimeter-thick carbon composite panel was embedded into the surface of a conical wind tunnel model. The thin panel was designed to vibrate from the flow passing over it so the interaction of the boundary layer with the panel response could be studied in detail. The incoming flow was characterized with high-speed imaging and pressure sensors, and the panel response was measured with accelerometers on the interior.
Structural components, whether on a flight vehicle or a wind tunnel model, possess certain inherent frequencies of structural response. When these structural frequencies correspond to those frequencies induced by the passage of turbulent spots, the flight component can be strongly excited.
To investigate this worst-case scenario, spots were periodically generated at frequencies that either matched or were offset from a structural natural frequency. When the spots passed at a rate that coincided with the natural structural vibration of the panel, the amplitude of the vibrations of the test article soared to levels 200 times greater than when the frequencies were not aligned.
In reality, a broad range of forcing frequencies will be generated by a transitional boundary layer in which thousands of spots pass by within a second. The frequency of the excited structural vibrations of the panel can be correlated to the rate of turbulent spot passage in the transitional boundary layer. To date, we have mapped out the turbulent spots and the vibrations they cause on this simple cone geometry, and we have modeled the results with our computational code. Next, we want to map this effect on geometries representing more realistic flight configurations.
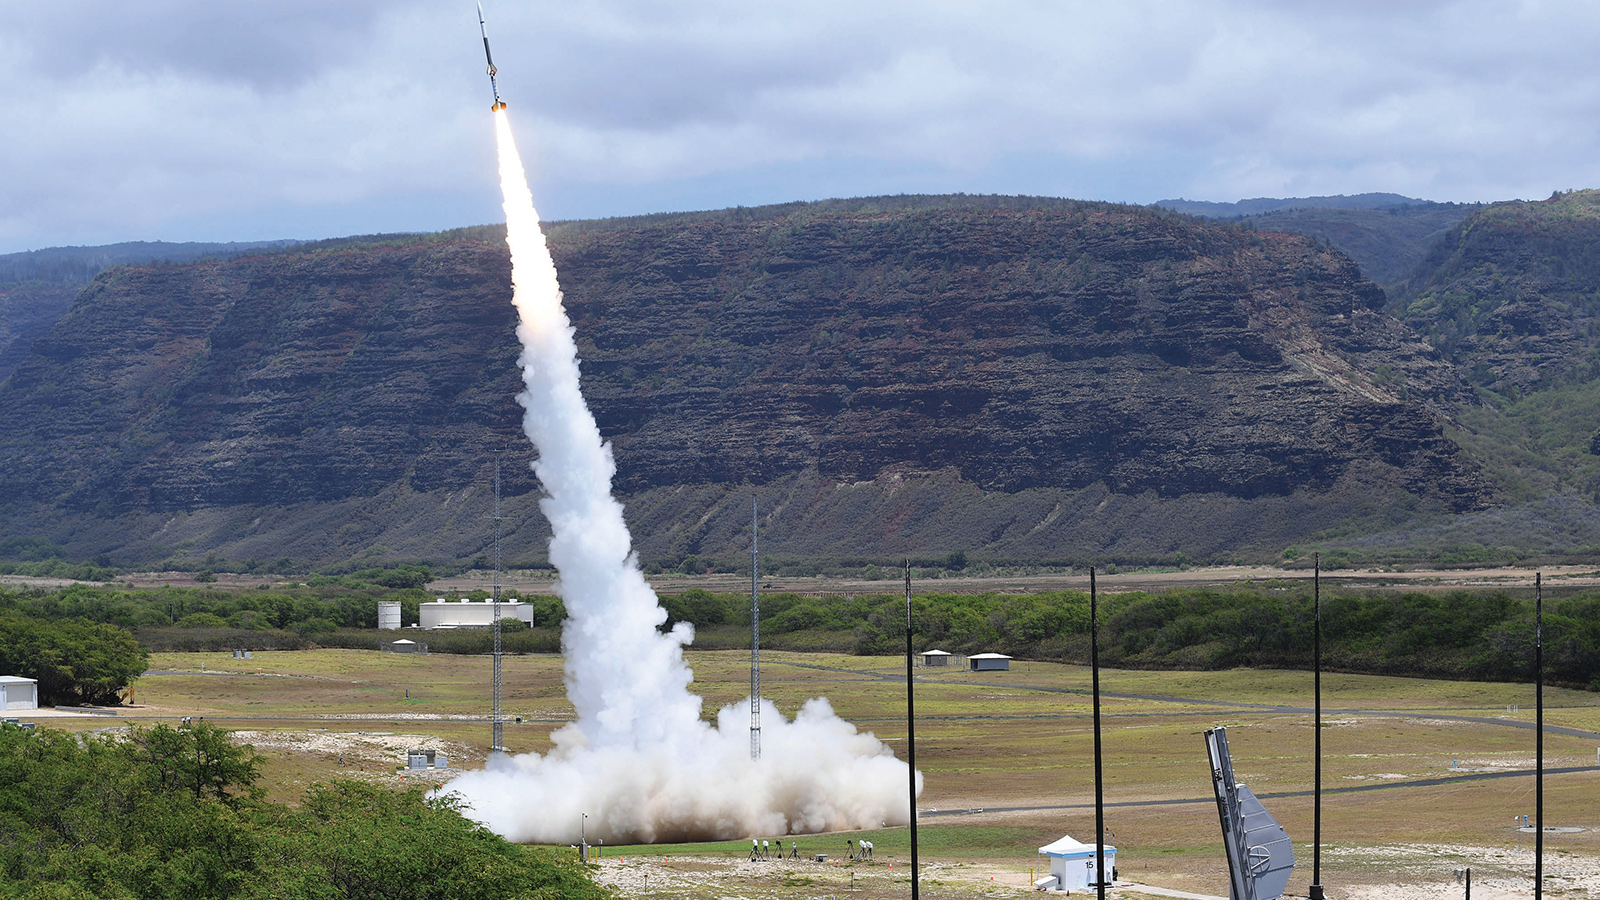
Wind tunnels ultimately are a simulation of flight conditions. To test out our models of structural response to turbulent spot passage, there was no substitute for actually flying. In April and August 2019, we conducted analogous experiments by instrumenting the nose shroud of a rocket in Sandia’s High Operational Tempo Sounding Rocket Program, or HOT SHOT. HOT SHOT launches inexpensive sounding rockets carrying scientific experiments and prototypes of flight technology. The data help researchers improve technologies, validate that they are ready for use and deploy them faster than with conventional validation techniques.
In flight, we measured hypersonic turbulent spots passing over the nose of one of the rockets and the resulting structural response. The turbulent spots looked very similar to the spots that were measured in the wind tunnel — however, the data is more sparsely sampled because of telemetry limitations that cap how much data can be collected in flight. By comparing the flight measurements to our database of wind tunnel measurements, we have a good understanding of what our flight data would look like if we had additional bandwidth in flight. The flight experiment also measured the structural response of the nose and internal payloads to the turbulent spot passage. That data are now being used to test flight codes to see if the response of the structure to the unsteady flow above it can be correctly estimated in a real flight environment.
If our work continues to progress as hoped over the next few years, we will have developed an important new tool for predicting the vibration environments of future hypersonic vehicles.