NOAA's newest weather satellites could extend forecasts to 7 days for hurricanes that threaten U.S.
NOAA says greenhouse gases are likely to make hurricanes as much as 11 percent stronger in the years ahead. This likelihood is fueling demand for even more accurate and longer-range track predictions. Enter the U.S. Joint Polar Satellite System spacecraft that NOAA is starting to launch. Debra Werner explains how these satellites could extend forecasts to seven days for storms that threaten the U.S.
Last September, with Hurricane Irma three days from Florida, residents of Cudjoe Key and vicinity probably breathed a cautious sigh of relief and turned their thoughts and prayers to Miami. The latest cone of uncertainty shifted the path of the storm’s center away from nearby Key West and eastward by about 140 kilometers toward Miami. If the forecast held, given the anatomy of hurricanes, the winds and surge of ocean water would be less severe in the Florida Keys on the west side of the storm.
This shift in the storm track turned out to be nothing more than a few hours of false hope for the Keys. The National Hurricane Center in Miami moved the track back to the west, and Irma made landfall at Cudjoe Key at 9:10 a.m. on Sept. 10, just 32 kilometers east of the original forecast and 70 minutes later.
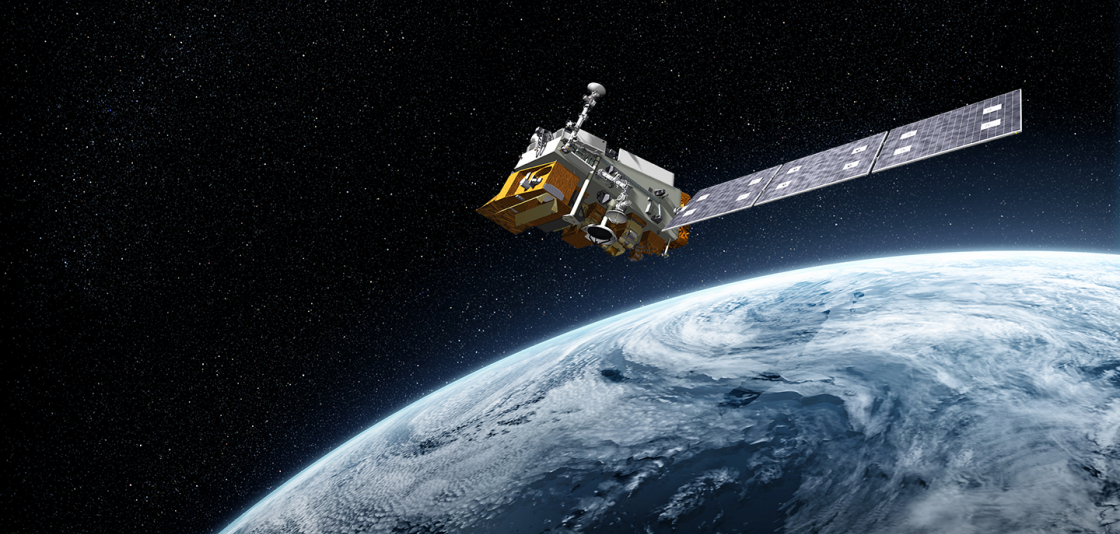
Knowing that residents make evacuation decisions at least partly based on these shifting forecast cones, U.S. meteorologists are determined to make their storm track and intensity predictions even more accurate. They’re about to get help in the form of a 2,295-kilogram weather satellite packed with innovations that have been years in coming.
NOAA-20 arrived in orbit in November and is undergoing commissioning before it’s put to work forecasting hurricanes and other weather phenomena. It is the first of four satellites in the $11.3 billion next-generation Joint Polar Satellite System that will gradually take over duties from today’s NOAA Polar Operational Environmental Satellites. Forecasters are confident about the performance of NOAA-20’s instruments, because nearly identical versions have been flying since 2011 on the Suomi National Polar-orbiting Partnership satellite, an experimental spacecraft named for U.S. weather satellite pioneer Verner E. Suomi who died in 1995.
The National Hurricane Center averages its track errors annually in miles, and there has been a decreasing average error since 1970, notwithstanding the wobble in the Irma track. “We are hoping that [NOAA-20] helps to continue this downward trend,” says Mark DeMaria, head of the center’s Technology and Science Branch. NOAA-20 was not in orbit for the 2017 season, but even without it, “preliminary data show that this was our best year ever,” he adds.
High value orbiters
Creating accurate hurricane forecasts is a bit like assembling a complex puzzle. Forecasters run data through various models, such as the National Weather Service’s Global Forecast System model and the European Center for Medium-range Weather Forecasting model. They then apply their experience and knowledge to narrow these “spaghetti” tracks into a predictive cone consisting of the possible paths of the storm center.
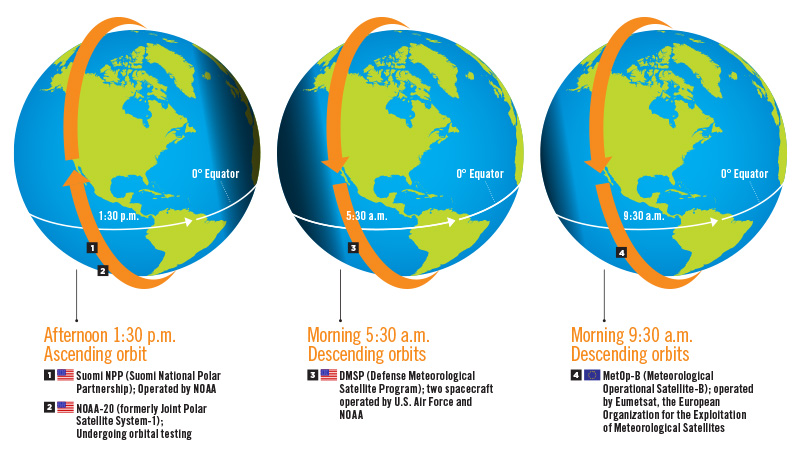
NOAA’s polar orbiters chip in by circling the globe from pole to pole 14 times a day, gathering observations of critical factors such as temperature and humidity. These readings are fed into the models together with data from hurricane hunter aircraft, balloons, ocean buoys and NOAA’s geostationary weather satellites.
The two classes of weather satellites operated by NOAA, the polar orbiters and geostationary satellites, each have distinct strengths. By flying 40 times closer to the atmosphere, polar orbiters provide higher fidelity data, including about specific weather features in their fields of view. Plus, their successive orbits add up to global coverage. That’s critical “because a storm brewing off the coast of Japan can unleash moisture plumes headed for North America,” says Mitch Goldberg, NOAA’s chief scientist for the Joint Polar Satellite System.
One thing the polar orbiters can’t do is provide an almost unblinking eye over the Americas, which is the role of NOAA’s geostationary satellites. The newest one, Geostationary Operational Environmental Satellite-16, or GOES-16, was called into action in September to take snapshots every 30 seconds of Hurricane Maria, after the weather radar in San Juan was knocked out. By stringing together these shots from the satellite’s Advanced Baseline Imager, meteorologists watched almost continuously as the structure of Maria’s storm center evolved. In December, after months of on-orbit check out, GOES-16 was designated as NOAA’s GOES-East satellite to keep watch over the East Coast, Atlantic Ocean and Caribbean Sea. A companion satellite, GOES-West, watches the Pacific Coast and Ocean.
While the GOES satellites can pause their north to south scanning and stare, it is the polar orbiters that account for 85 percent of the data that’s fed into the prediction models. Forecasters expect major improvements in that data from NOAA-20, enough so that in the 2018 hurricane season, they will begin experimenting with six- and seven-day hurricane forecasts with a goal of someday publishing cones of uncertainty looking that far ahead, compared to today’s cones that look three to five days ahead. The National Hurricane Center will not release those experimental forecasts to the public until they evaluate them for accuracy, says DeMaria.
Sophisticated instruments
To fully appreciate NOAA-20’s contribution to weather forecasting, it helps to delve into the technology, which has been in development since the 1990s. To predict the path of a hurricane, forecasters must map upper atmospheric wind patterns, looking for areas of low barometric pressure that guide storms along specific tracks. To find these upper level lows, forecasters need to identify changes in temperature from one area to the next high in the atmosphere.
Predicting intensity is even more challenging. Forecasters need extensive observations of wind, temperature and moisture in and around the storm center to tell whether warm moist air in its path will fuel it or whether pockets of cool dry air will weaken it.
For the track measurements, forecasters will especially rely on temperature readings by two NOAA-20 instruments: the Advanced Technology Microwave Sounder, or ATMS, and CrIS, short for Cross-track Infrared Sounder.
ATMS observes microwave radiation emitted by Earth’s surface and atmosphere with rotating reflectors that collect energy in 22 spectral bands ranging from 23 gigahertz to 183 GHz. The two rotating reflectors direct energy onto fixed reflectors on the opposite ends of the instrument where the energy is focused through a grid and into small antennas called feedhorns. Inside the feedhorns, the energy is amplified and filtered into discrete channels before it is steered to detectors. ATMS recalibrates itself once after each ground scan by staring into deep space and at an internal calibration target. Because clouds do not completely block microwaves, forecasters can measure atmospheric temperature, the critical factor for finding the upper level lows, and also moisture even when it is cloudy, in addition to gauging precipitation rates, snow and ice cover.
The infrared readings from CrIS complement the microwave data from ATMS. Clouds largely block infrared energy from below, but everywhere else CrIS measures temperature and also the atmospheric water content that can strengthen storms. CrIS does this in a multistep, intricate process that nevertheless happens in seconds for each collection. Arriving radiation is converted to an interference pattern through an optical process first conceived in the 1880s by German-born American physicist Albert Michelson. Next, a telescope focuses this Michelson interference pattern into an aft optics system that directs it to cooled photo-voltaic detectors. These separate the energy into three spectral bands and create an interferogram that is divided into 2,200 spectral bands from shortwave through longwave infrared through a process invented by the French mathematician and physicist Joseph Fourier. Like ATMS, CrIS recalibrates itself after each scan with an internal calibration target and view of deep space. By filtering out certain spectral bands and combining others, forecasters can focus on specific layers of the atmosphere.
ATMS will take over for the Advanced Microwave Sounding Unit and the Microwave Humidity Sounder on NOAA’s other polar orbiters. ATMS has three more spectral channels and a wider ground swath. CrIS observes light in 2,200 spectral bands compared with 19 spectral bands on its predecessors, the High-Resolution Infrared Radiation Sounders.
Once NOAA-20 is fully commissioned, its readings will join those from Suomi NPP, which orbits 50 minutes ahead of NOAA-20. Having two satellites staggered like this will improve the odds of capturing a close-up look at a specific weather feature. The ATMS coverage swath is 2,500 kilometers across: “The information we get depends on where [ATMS] hits the storm, whether it is on the eye or on the side of the eye,” DeMaria says. “But if we have two passes 50 minutes apart, we have a pretty good chance of getting a solid view of the eye.”
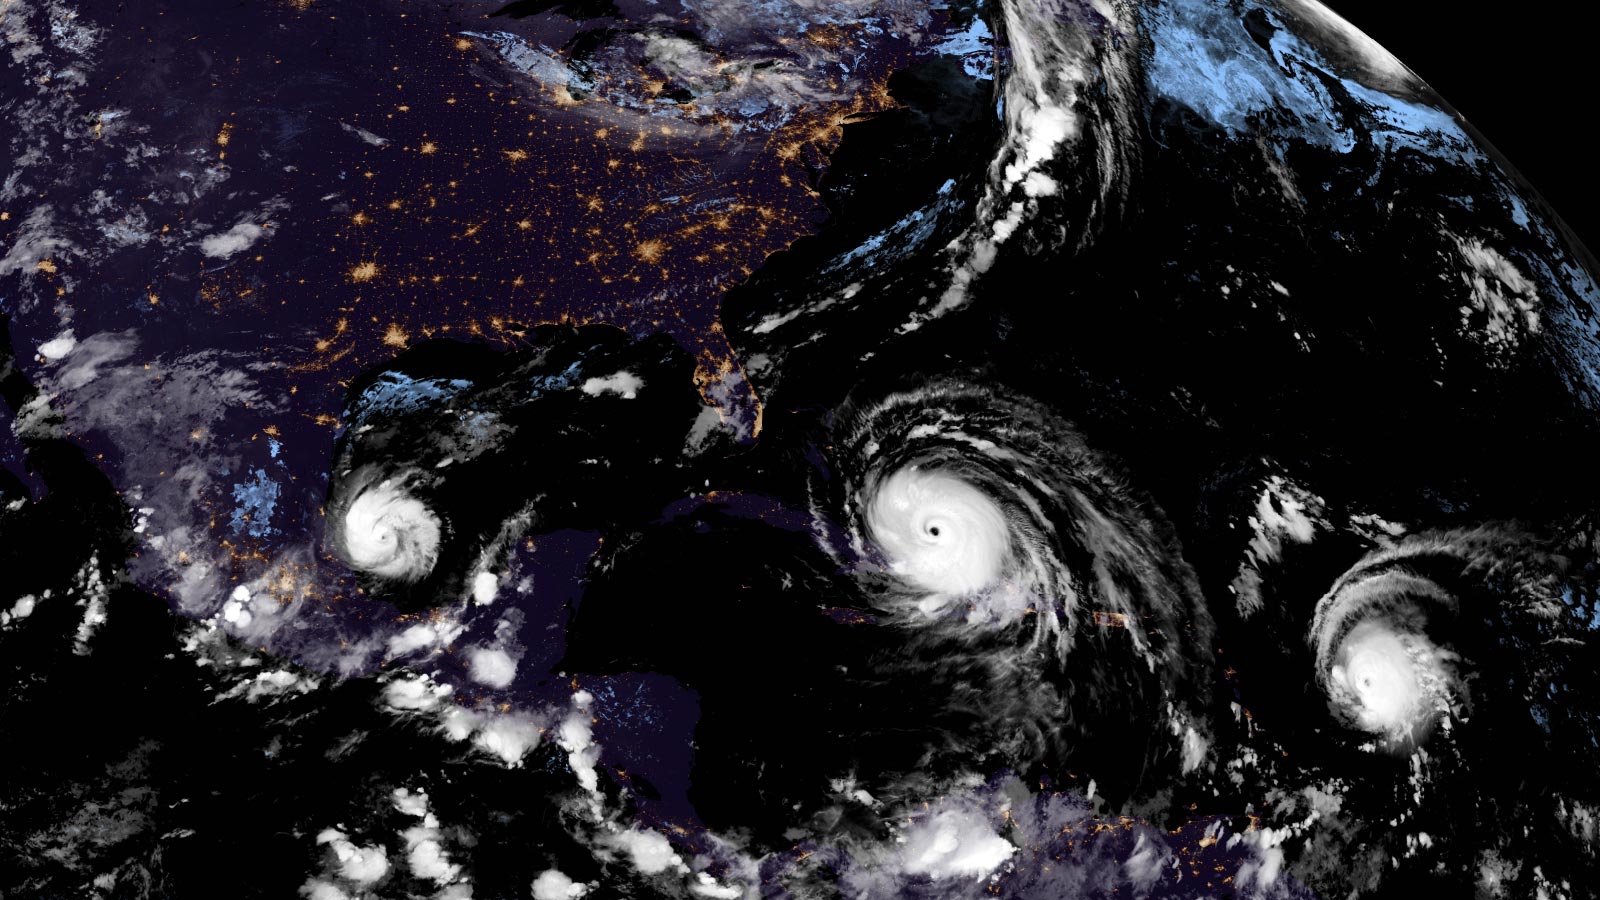
Temperature and wind speed aren’t the whole story. Forecasters also need to see how storms are evolving. That’s where the geostationary satellites and a third NOAA-20 and SNPP instrument come in: the first-of-its-kind Visible Infrared Imaging Radiometer Suite, or VIIRS (pronounced VEERZ). The tops of clouds are cold, so they stand out in VIIRS imagery. Even before a hurricane forms a tight eye, forecasters can examine VIIRS imagery and find the center of circulation. VIIRS has a day-night band sensitive enough to reveal storm clouds in scant moonlight.
“Hurricanes like Irma are pretty easy to track even at night with infrared imagery,” DeMaria says.
VIIRS does this by rotating a telescope to capture light from Earth in 22 spectral bands. Other optics then direct this light into VIIRS’ aft optics assembly and through a beam-splitter. This sends visible and infrared wavelengths to four focal planes cooled to cryogenic temperatures to ensure sensitivity.
The version of VIIRS on Suomi NPP featured prominently in forecasting the track and intensity of the disturbance that would grow into Hurricane Harvey and inundate Houston with flooding rains. On Aug. 17, “potential tropical cyclone 9” brought heavy rain and wind gusts to the Lesser Antilles islands in the Caribbean Sea. Two days later, it all but petered out in the eastern Caribbean Sea. The question was what would happen next.
“We couldn’t see the low-level circulation and tell how organized it was at night without visible imagery. The day-night band gives us the ability, provided we have some moonlight,” DeMaria says.
Forecasters correctly predicted the remaining circulation would perk up. On Aug. 23, the storm became a tropical depression in the Gulf of Mexico and strengthened into Hurricane Harvey on Aug. 24.
With VIIRS flying on NOAA-20 in addition to Suomi NPP, forecasters will have a second source of imagery. Just as important as the extra data is McMurdo Station in Antarctica, where NASA and NOAA began operating a new network of satellite antennas in August. Suomi NPP downloads its data in X-band only once each orbit, specifically to a ground station in Svalbard, Norway. NOAA-20 downloads stored data via Ka-band twice each orbit to Svalbard and McMurdo. Suomi NPP can’t do that because McMurdo does not have an X-band receiver.
Downloading twice cuts in half the time forecasters must wait for observations. Suomi NPP sends 95 percent of its data to forecasters within 100 minutes. NOAA-20 aims to share 90 percent of its data within 40 minutes.
That adds up to far more frequent updates on storms like Irma, Harvey and Maria.
What difference could the addition of NOAA-20 have made to the Irma track? DeMaria says it’s “difficult to determine which sources of error” contribute to the history of an individual forecast, such as the temporary eastward shift of Irma’s track. Typically, the main sources of error are insufficient observations “to adequately map the wind, temperature and moisture field around and in the storm,” and also “errors in the way the computer models handle certain physical processes such as the turbulence in the boundary layer, energy exchanges with the ocean, and the way the models treat the clouds that form.” If all goes as planned, NOAA-20 will address the observations part of the error equation.
“That is a big deal for us,” DeMaria says.
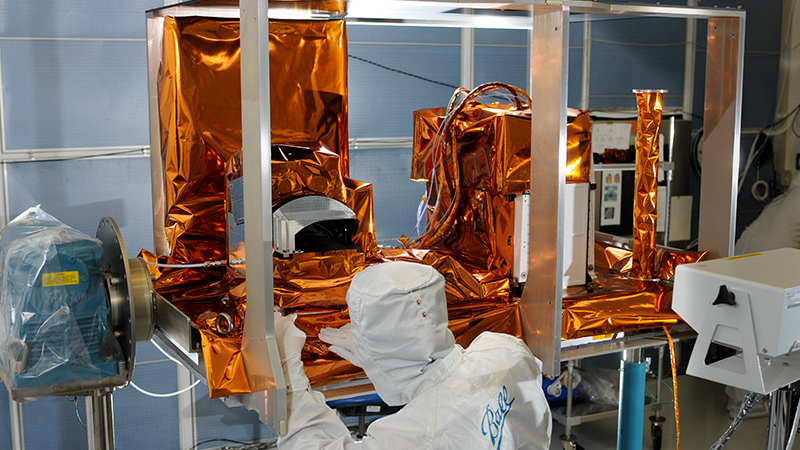
Commissioning NOAA-20
NOAA meteorologists aim to start feeding data from NOAA-20’s three weather instruments into numerical weather prediction models sometime in the “spring.” They can’t offer a more specific timeline because they don’t know how long it will take to calibrate these sensors and validate their datasets by comparing them with readings from other ground, airborne and space-based sensors.
NOAA is turning on the instruments according to a planned sequence that was scheduled to run through early January.
Once all the instruments are turned on, the NOAA-20 science team expects to spend about three months calibrating and validating them, a process they expect to run smoothly because NOAA-20 carries sensors that are nearly identical to the ones on a pathfinder satellite called the Suomi National Polar-orbiting Partnership. Validating Suomi NPP sensors took two to three times as long as expected for NOAA-20, says Arron Layns, who leads NOAA’s JPSS algorithm management.